
Monitor Traffic with Network Proxy
Vega Studio’s Network Proxy tool monitors and troubleshoots network activity in Vega apps. Built on the mitm-http-proxy library, it acts as an intermediary proxy between your app and its server, allowing inspection and modification of network traffic.
The tool helps:
- Debug network issues
- Inspect API calls
- Analyze performance bottlenecks
- Verify data transfer in your Vega app
The tool captures traffic from:
- HTTP
- HTTPS
- WebSocket
- XMLHttpRequest
- Media Player requests
Prerequisites
You must have the following requirements:
- Installed Vega SDK and Vega Studio
- Fire TV Stick device or Vega Virtual Device
- A Vega app project
Setup Network Proxy
-
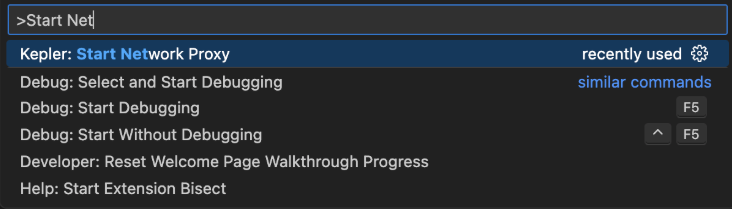
Open the command palette in Visual Studio (VS Code).
Mac: Shift+Command ⌘+P
Linux: Ctrl+Shift+P

-
Enter Start Network Proxy.
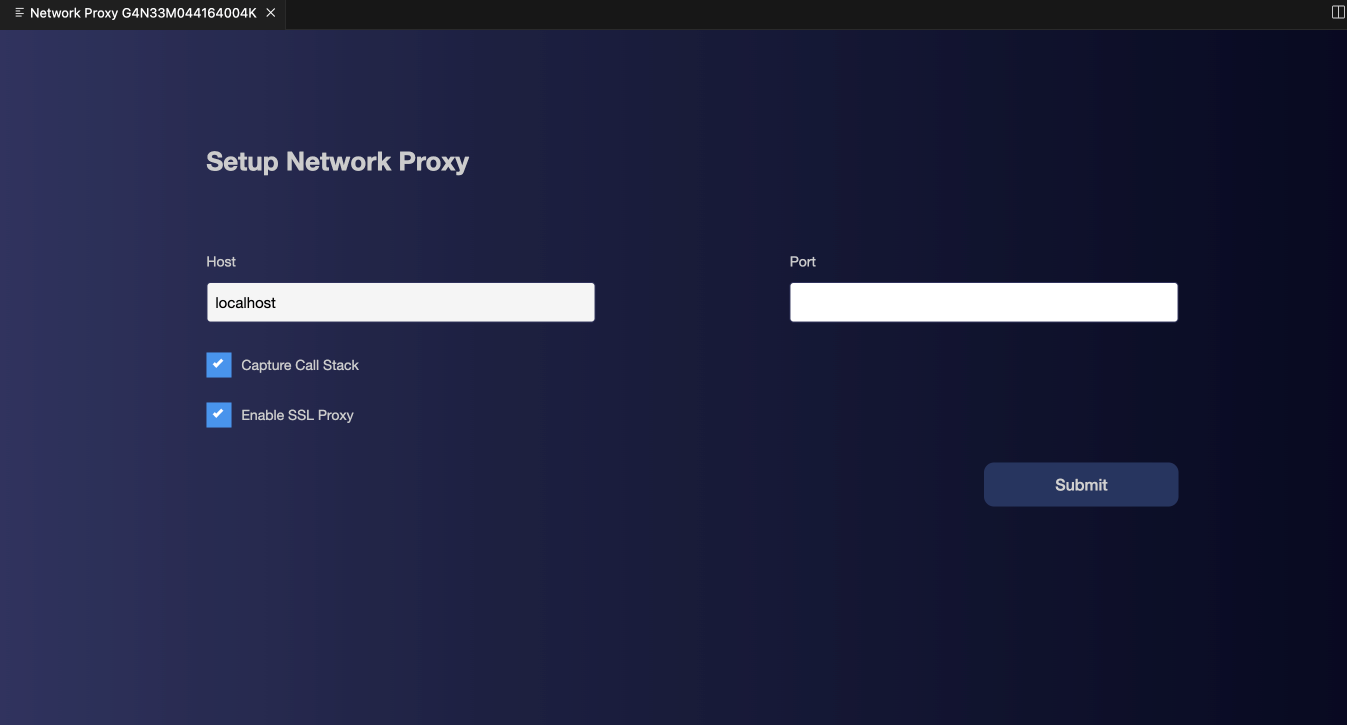
The Setup Network Proxy user interface (UI) appears with Capture Call Stack and Enable SSL Proxy selected by default.
Important: If you deselect the Enable SSL Proxy, the tool won’t generate a certificate, and unable to intercept HTTPS traffic. If you deselect the Capture Call Stack, Network Proxy’s UI hides this option. -
Enter 4-digit port number in the Setup Network Proxy UI.
Tip: Avoid using common ports (for example, 8081) or other port in use by other services or app to prevent any potential conflicts. -
Click Submit.
The Network Proxy user interface opens, displaying your device serial number.
-
Set up port forwarding:
Port forwarding directs the device to send requests meant for a specific port to your computer instead.
At the command prompt, run:
vda reverse tcp:<remote-port> tcp:<local-port>Replace
<remote-port>with the port you configured in theproxy-config.jsonfile on your Fire TV Stick. Replace<local-port>with the port you configured for Network Proxy on your development machine.Example:
vda reverse tcp:8888 tcp:8888Tip: Stop port forwarding when you're done debugging to restore your device's normal network configuration.You should see a confirmation message indicating that the proxy has started. The proxy tool automatically:
- Creates
assets/rawdirectory - Generates
proxy-config.json - Creates SSL certificate (
ca.pem) (this option is enabled by default)
- Creates

Network Proxy user interface
Network Proxy main interface consists of a:
- Control panel
- Traffic view
- Detailed panel
Control panel
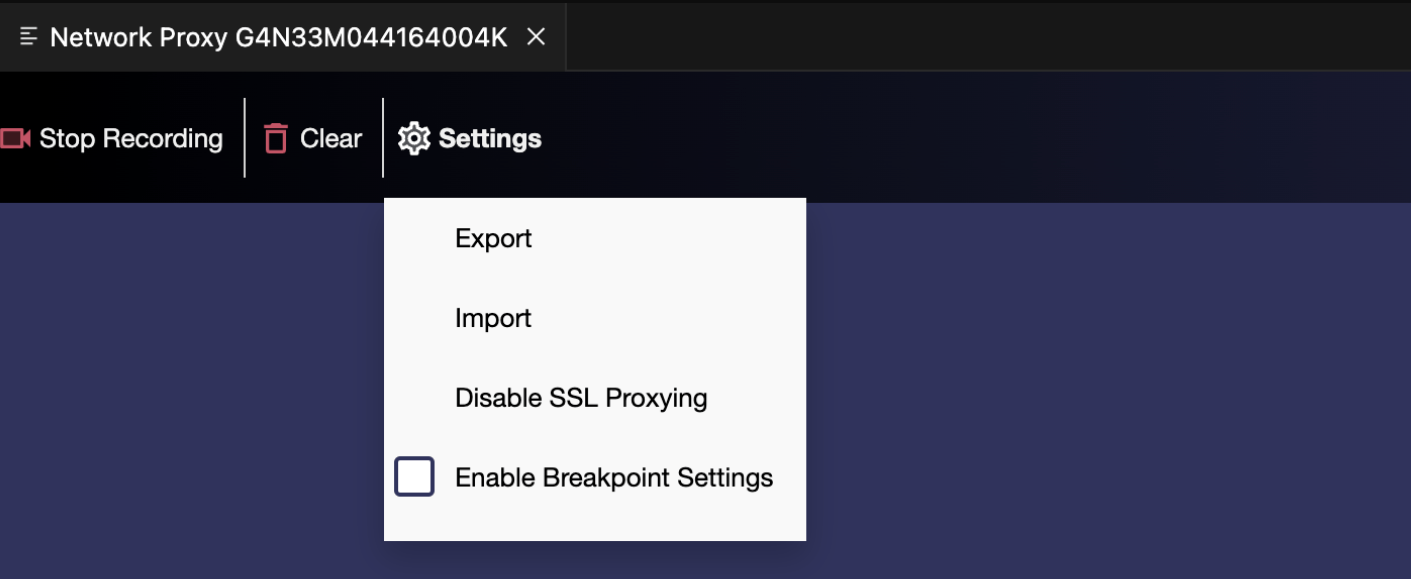
The control panel provides options to:
- Start or Stop Recording
- Start Recording - Begins capturing all network activity. When recording:
- The tool displays all network traffic
- You can monitor requests and responses in real-time
- Stop Recording - Stops capturing new requests or responses.
- Start Recording - Begins capturing all network activity. When recording:
- Clear - Resets the session and removes all captured data
- Settings - Provides options to:
- Export - Saves sessions to JSON format in your Vega app's generated folder.
- Import - Loads previously exported sessions.
- Disable SSL Proxying - Controls HTTPS traffic interception.
- If enabled, the tool intercepts, decrypts, and displays HTTPS traffic in the interface.
- If disabled, the tool doesn't decrypt HTTPS traffic.
-
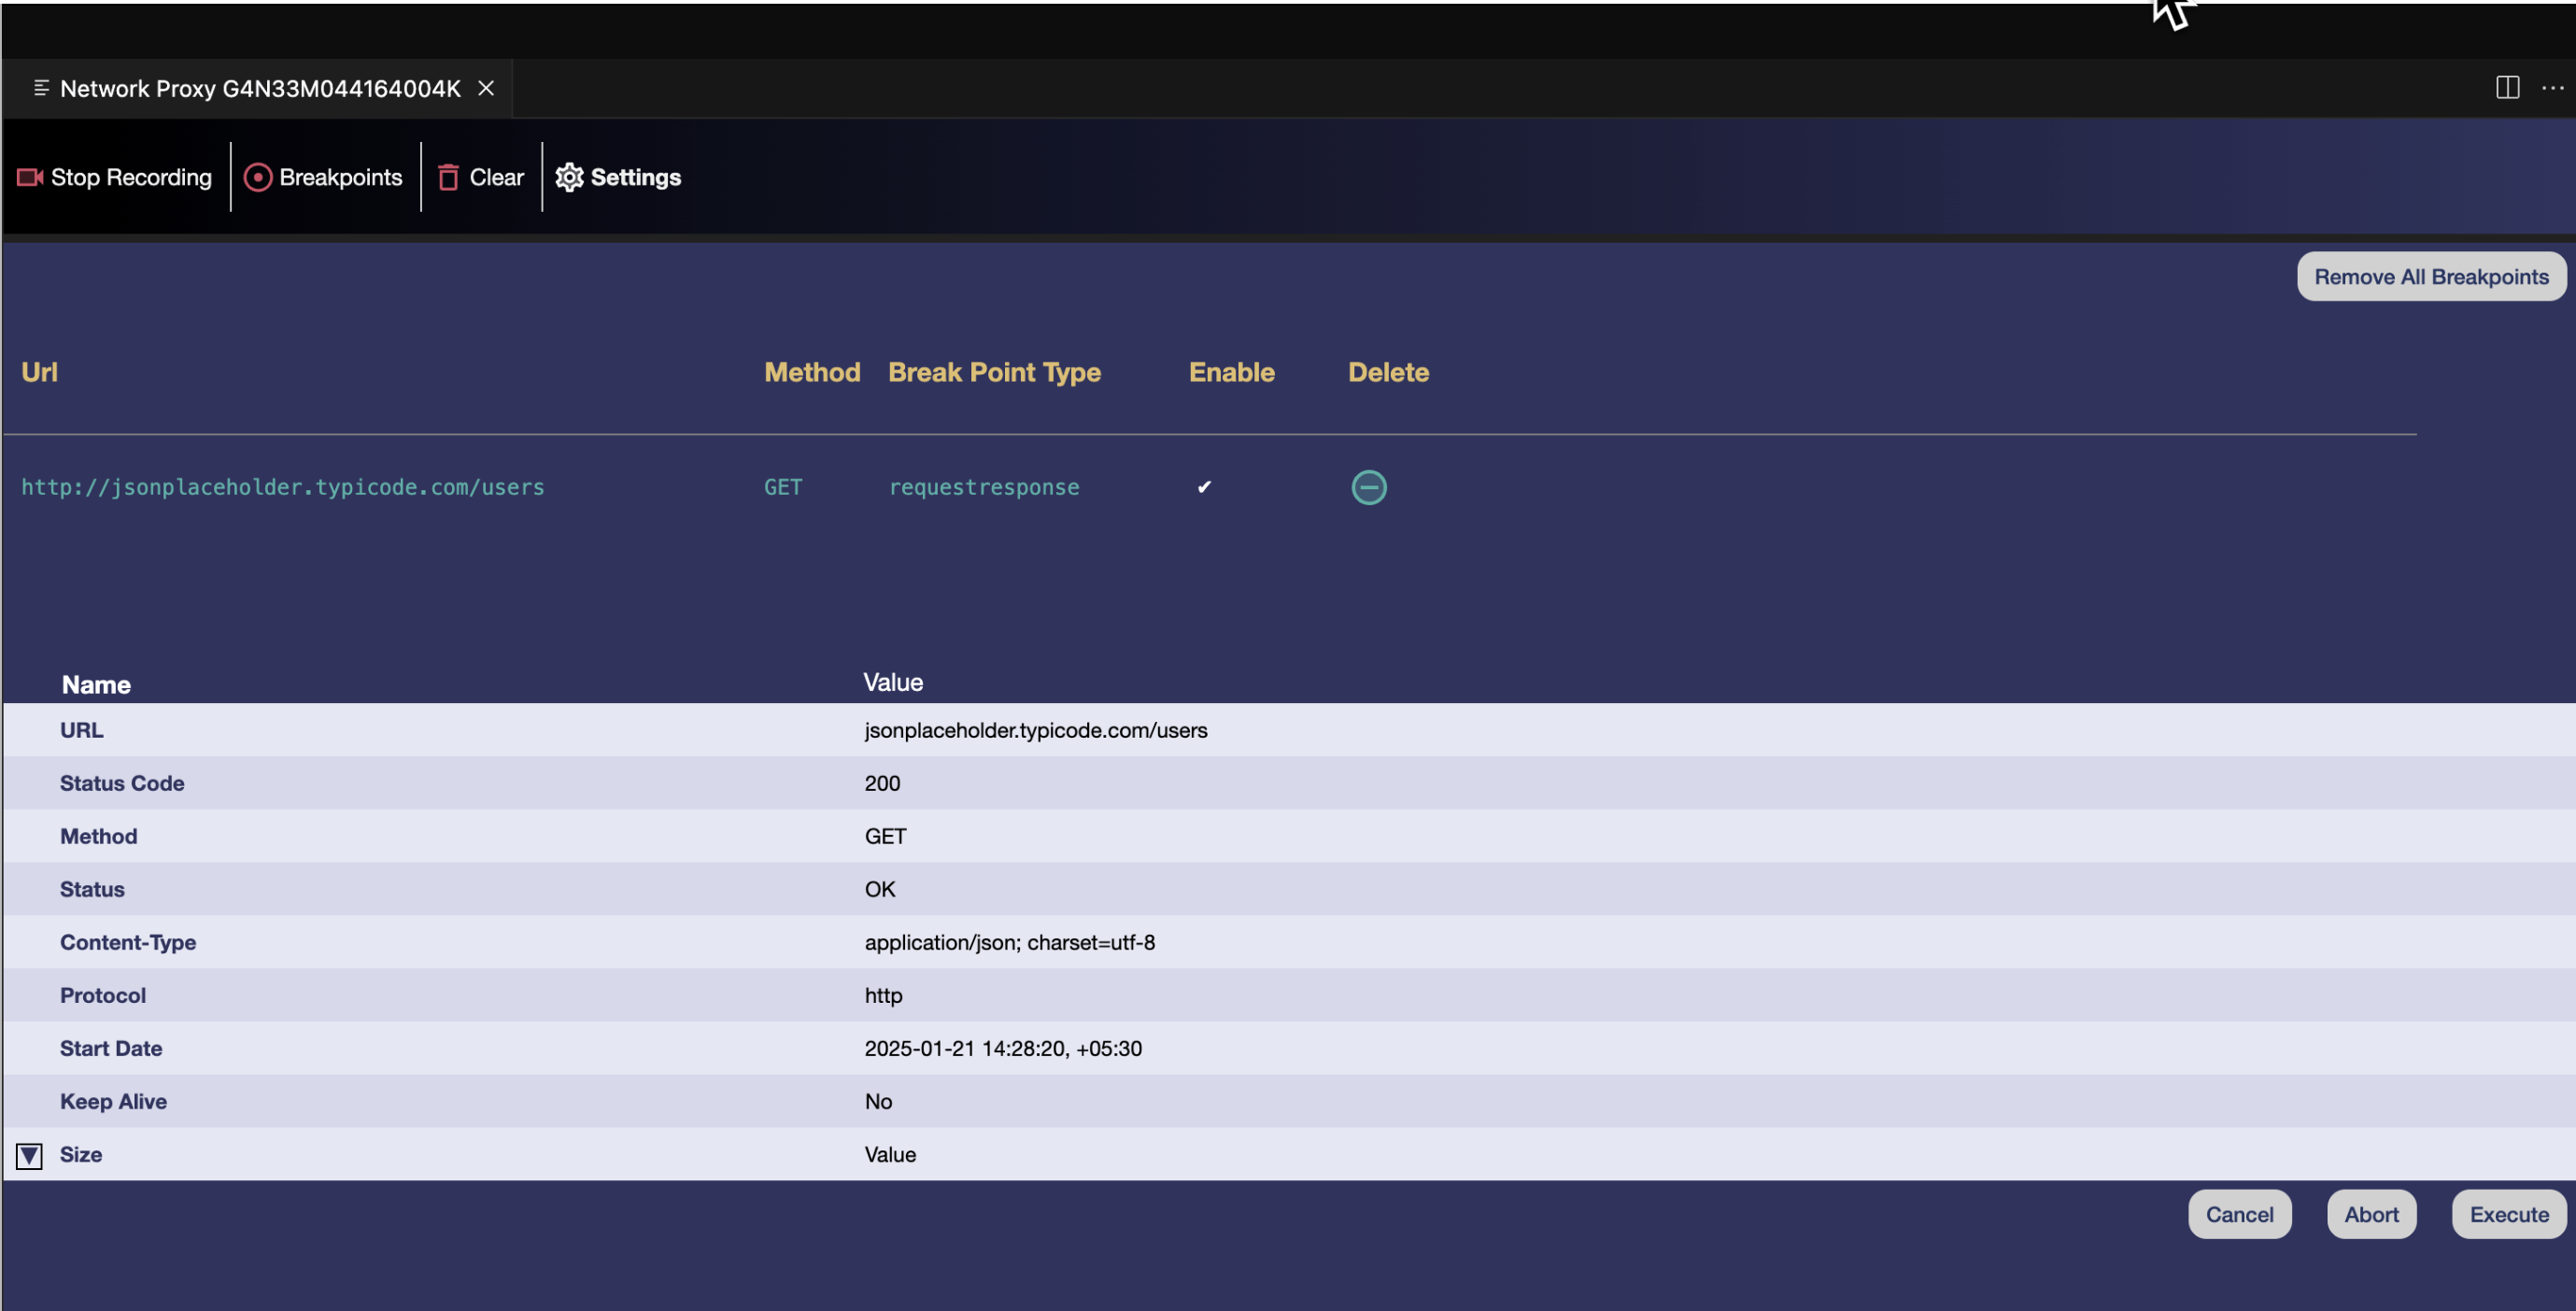
Enable breakpoint settings to set a breakpoint then abort, cancel, or resume.
-
When you mark the Enable Breakpoint Settings checkbox, it activates the breakpoint feature and lets you set a breakpoint.
-
Set a breakpoint. Click the + icon next to any network call. The tool pauses the traffic at that set point.

-
Abort, cancel, or resume traffic flow

When the tool triggers a breakpoint, click the respective button:
- Abort - Cancels the request
- Cancel - Stops the breakpoint
- Resume - Continues normal flow
-
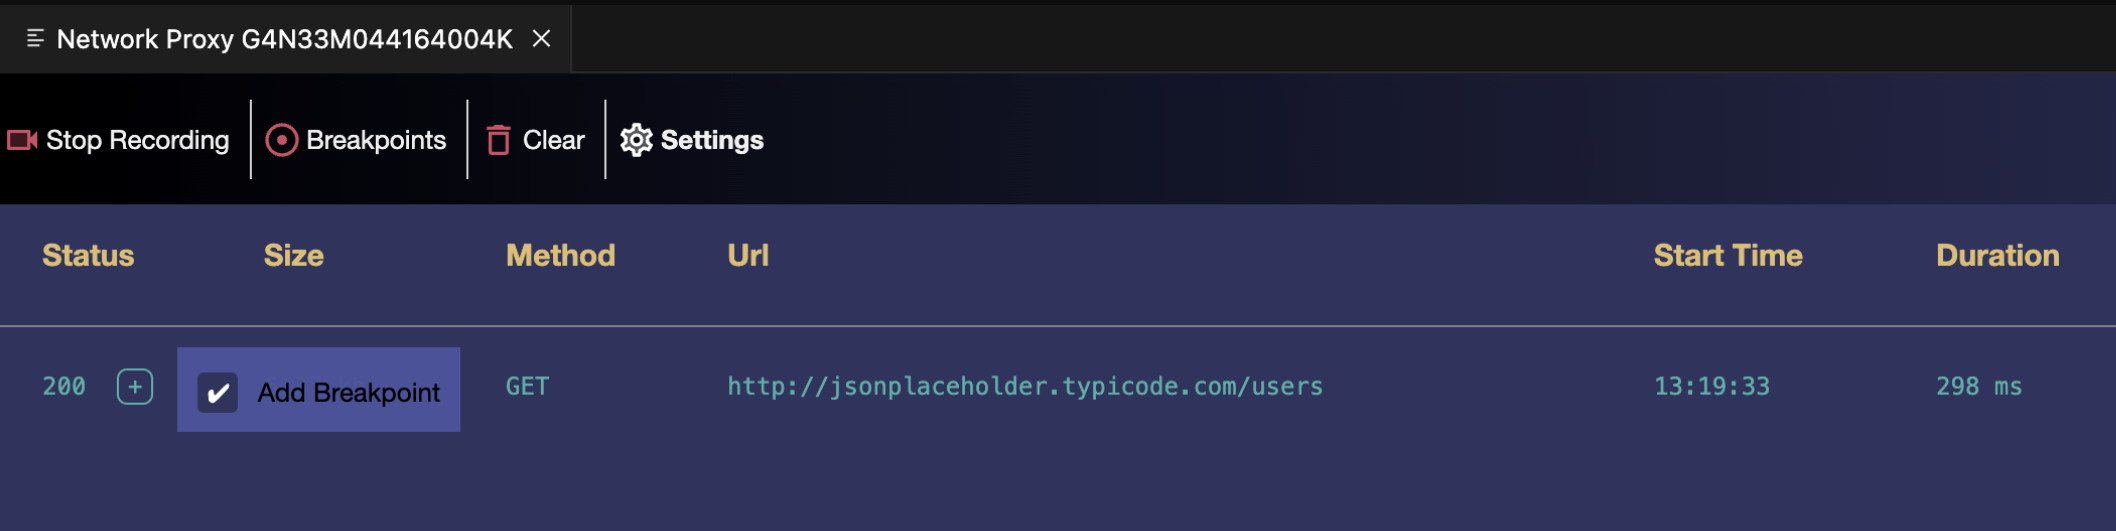
Traffic view
Network Proxy displays each intercepted request or response with the following details:
- Status - The HTTP response code, indicating the result of the request (for example, 200 or 404).
- Size - The size of the response body.
- Method - The HTTP method used (for example, GET, POST, PUT, or DELETE).
- Url - The full URL of the request, including the domain and path.
- Start Time - The timestamp when the response was sent.
-
Duration - The time taken to process the request and receive the response (in milliseconds).
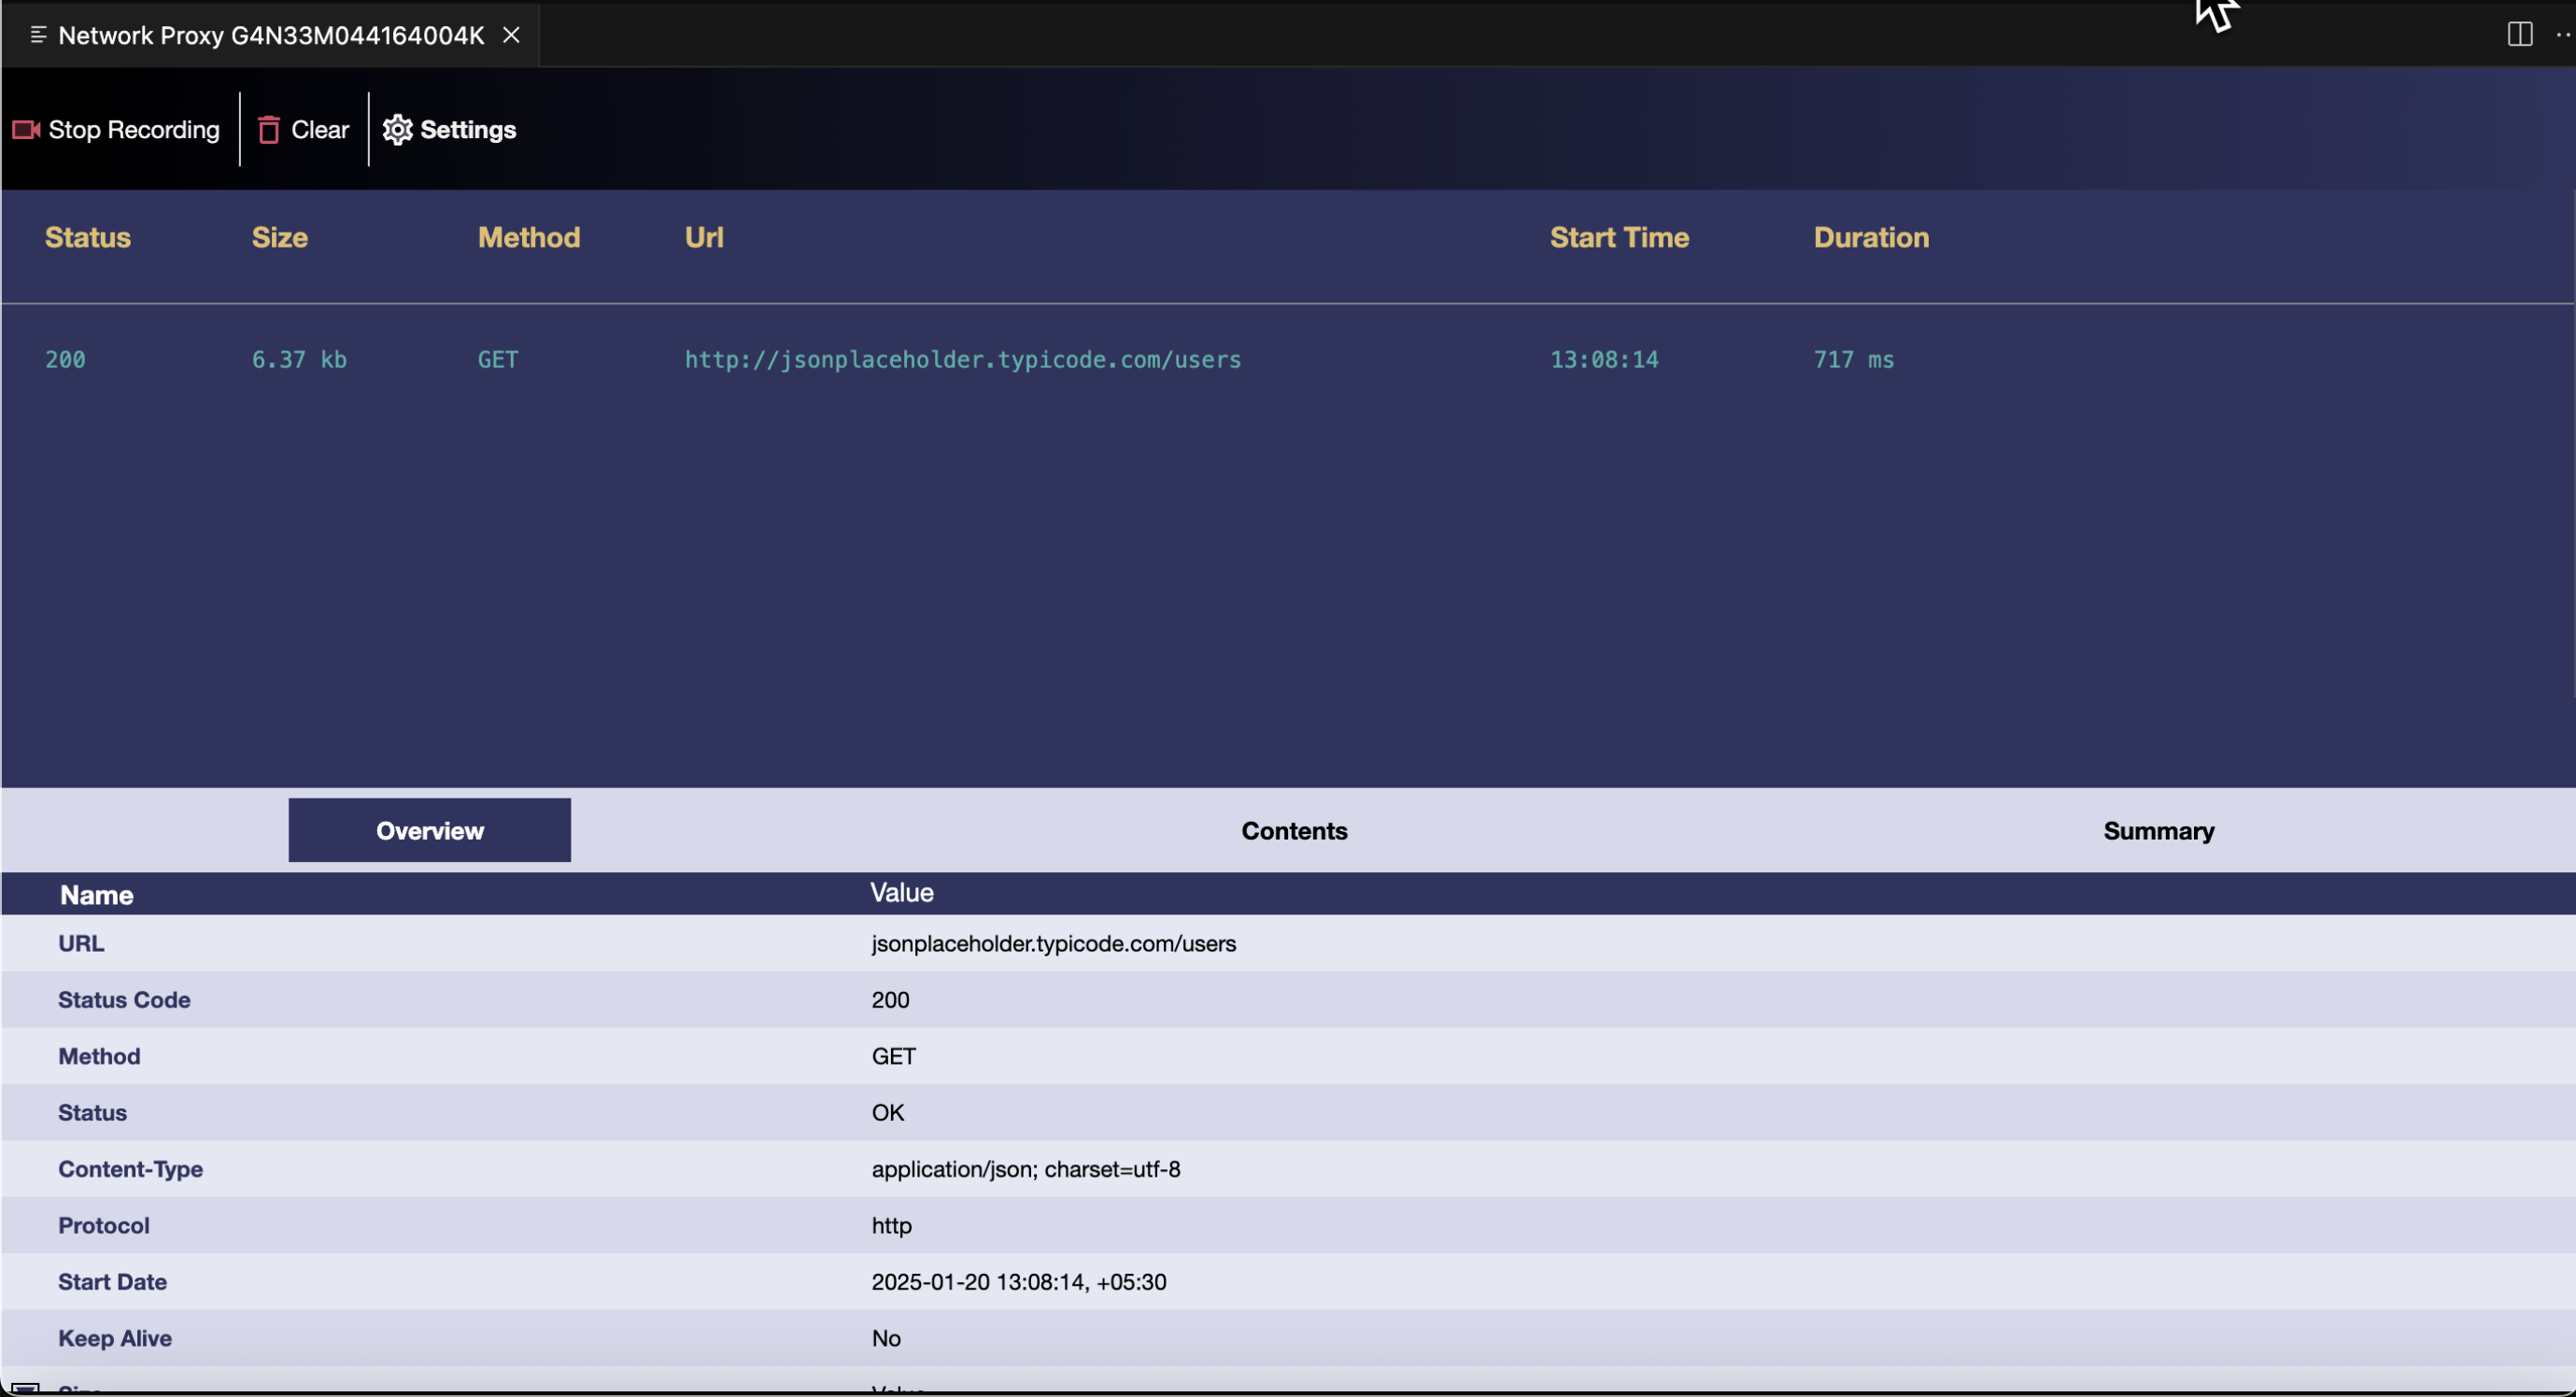

Detail panel
When you select a specific row of intercepted data, a new panel opens at the bottom, providing insights into the selected network traffic.
- Overview - Provides a high-level summary of the selected traffic, including general metadata and status information.
- Contents - Displays the full details of the request and response, such as headers, body content, and other relevant data.
- Request Headers - Full set of headers sent with the request.
- Response Headers - Full set of headers sent with the response.
- Body Content - Raw or formatted body (JSON, HTML).
- Summary - Provides a summary of key metrics, such as host url, body size, Mime type, status code, time related to the selected network traffic.
Cleanup after debugging
Before you submit your app for production:
- Delete the proxy-config.json file and any certificate file (for example, assets/raw/ca.pem) from the app.
-
Clean your project:
vega clean - Build your app.
Troubleshooting
If you encounter issues while using the Vega Studio's Network Proxy tool, see Troubleshoot Network Proxy Issues.
Related topics
Last updated: Sep 30, 2025