
Manage Files, Crash Reports, and Logs
Vega Studio, an extension in the Visual Studio Code (VS Code), enhances app debugging by providing comprehensive management of device files, crash reports, and logs. Through Vega Studio, you can monitor app behavior, investigate crashes, and analyze system logs from a centralized location. These debugging capabilities help you identify issues and verify how your app behaves during development.
Prerequisites
Before you begin, complete these steps:
- Open your app project in VS Code.
-
Connect your device through USB or network.
- See Run your app in Vega Virtual Device or Fire TV Stick for instructions.
-
Your device appears in Vega Studio's device list.
- See Set Up and Use Vega Studio to learn the basic features and advance configuration options.
Manage crash reports
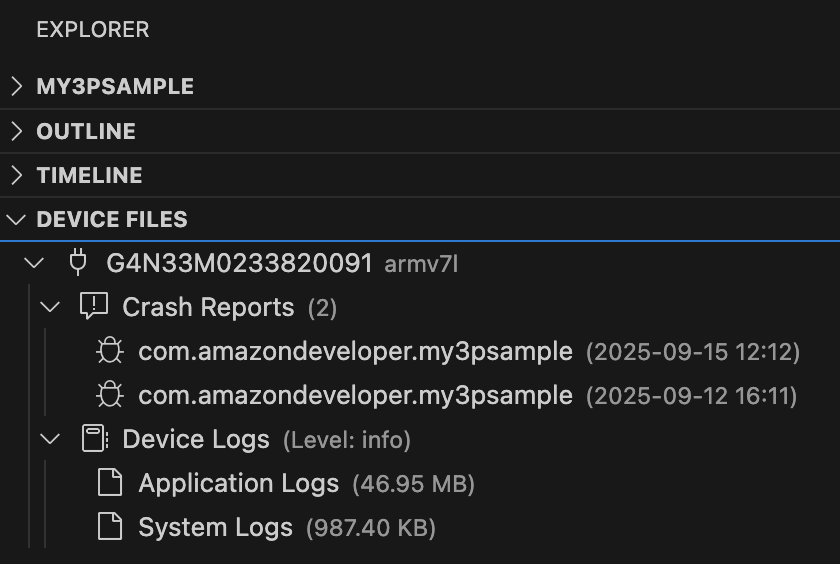
Use the Device Files view in the Explorer sidebar to manage crash reports. This view automatically detects and displays crash reports from your connected devices.
Open and symbolicate crash reports
- Click the corresponding item from the list to open crash reports.
-
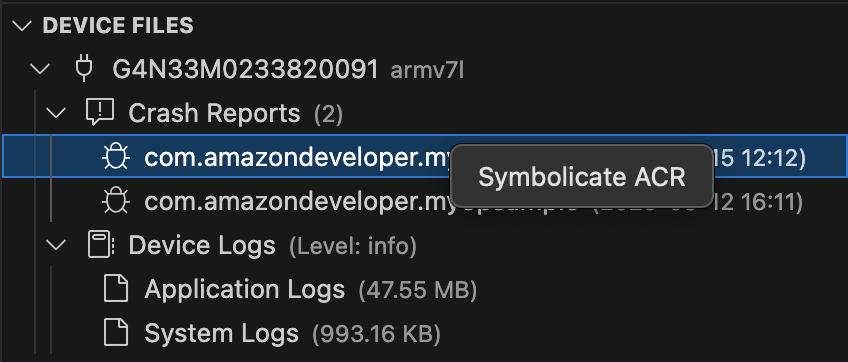
Right-click and select Symbolicate ACR to convert crash reports into readable format.
- See Debug App Crash Using Vega Studio for details.
Filter crash reports
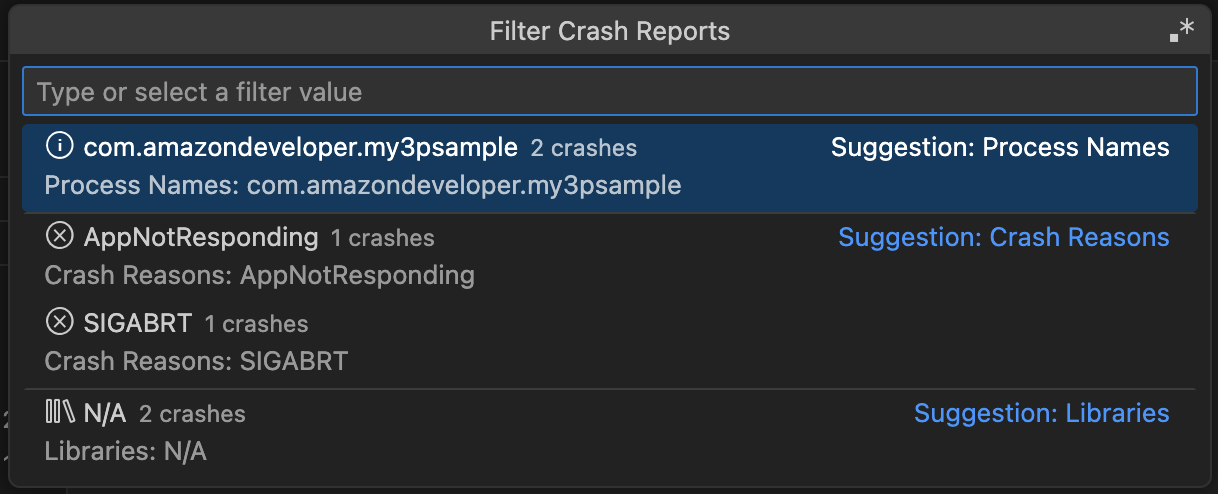
Click the funnel icon next to Crash Reports to display the Filter Crash Reports user interface.

You can filter by name or using regular expressions.
Configure automatic crash detection
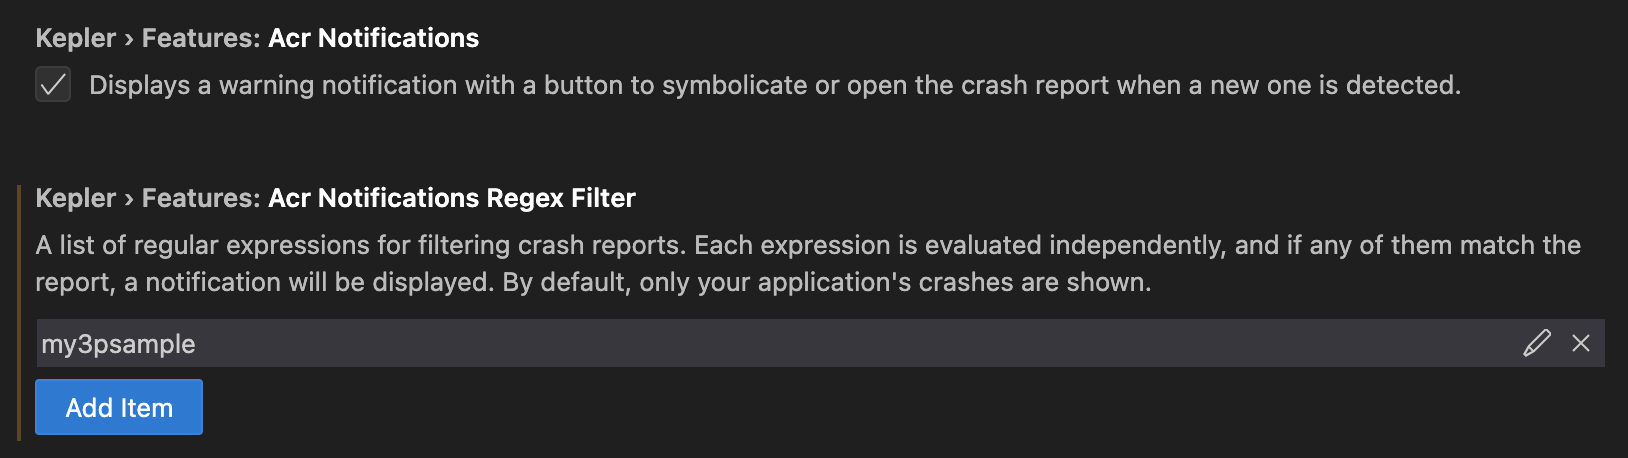
Vega Studio automatically detects new crash reports and shows notifications. You can customize this behavior:
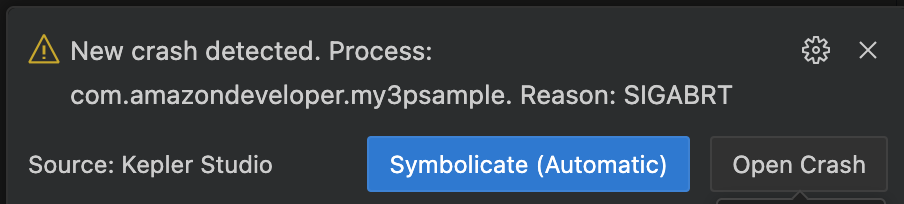
To disable notifications or configure filters, go to Vega Studio extension settings (Kepler > Features > Acr Notifications).
View live logs
Use the live log streaming for real-time debugging during active development. The Show Logs button in the VS Code status bar is the recommended method.
- Run your app in VS Code.
-
Click Show Logs in the status bar.
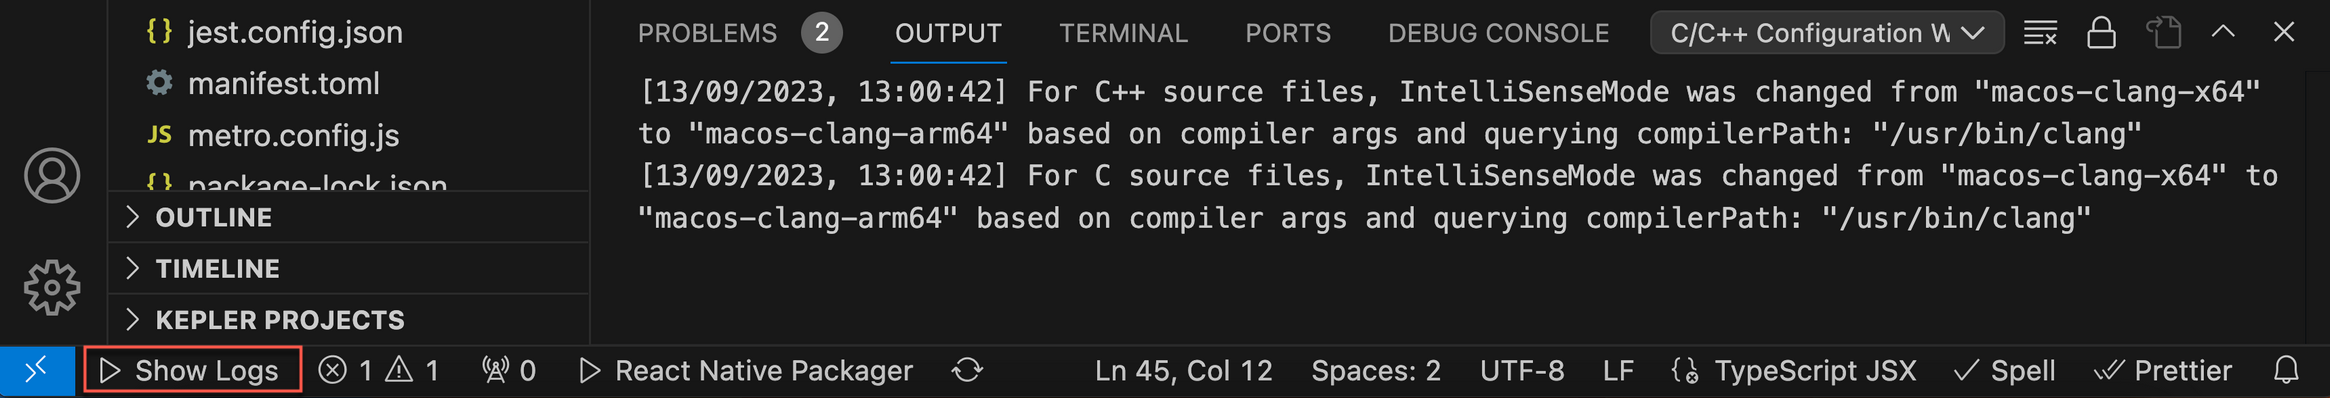
Show Logs button in status bar -
Choose your device: Vega Virtual Device or Fire TV Stick.
If you use a Fire TV Stick, connect it through USB. If you have multiple projects, select the target project when prompted.
Logs stream to the App Logs channel while your app runs. For idle apps, check the Output channel.
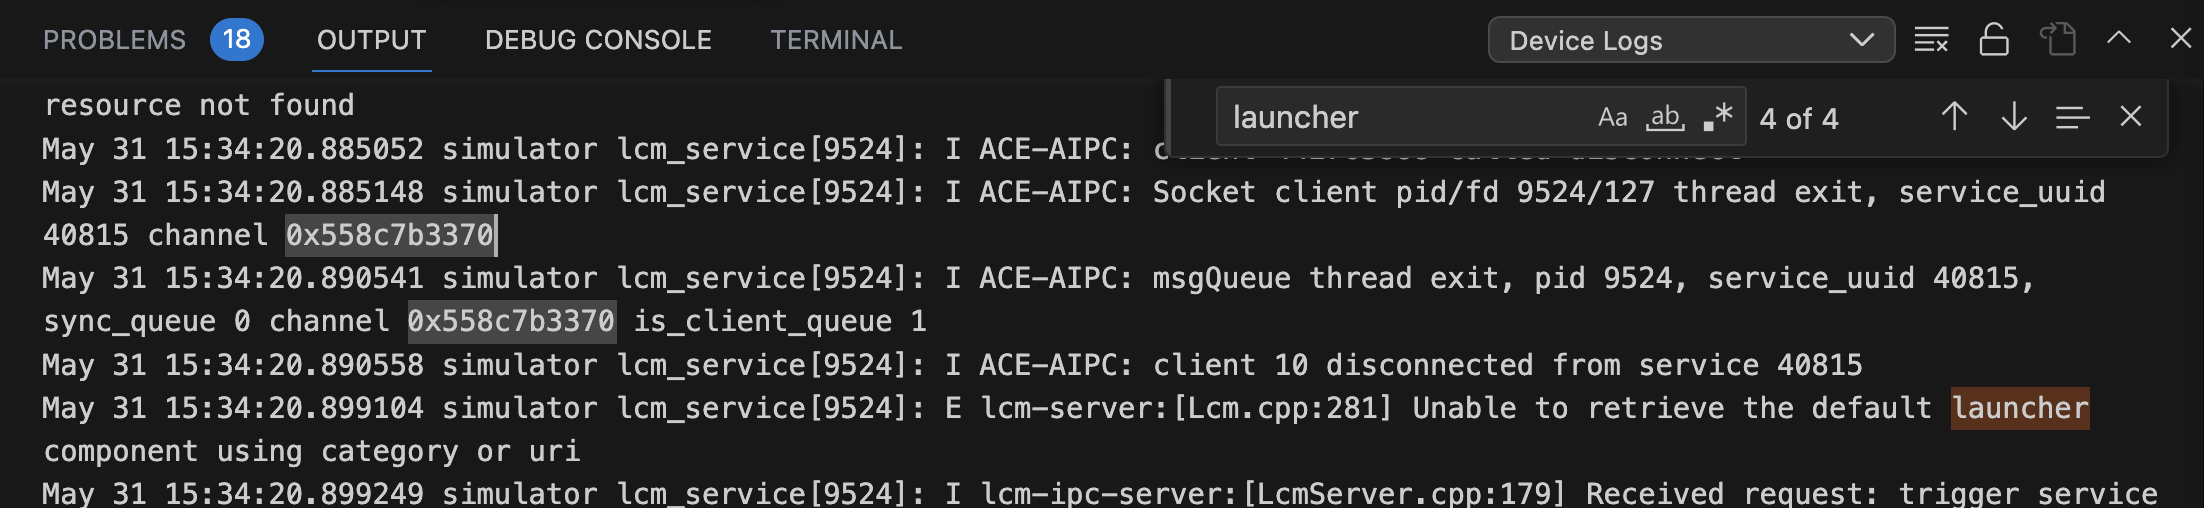
App Logs output channel -
Click Stop Logs in the status bar to end streaming.
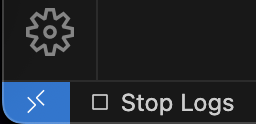
Stop Logs button
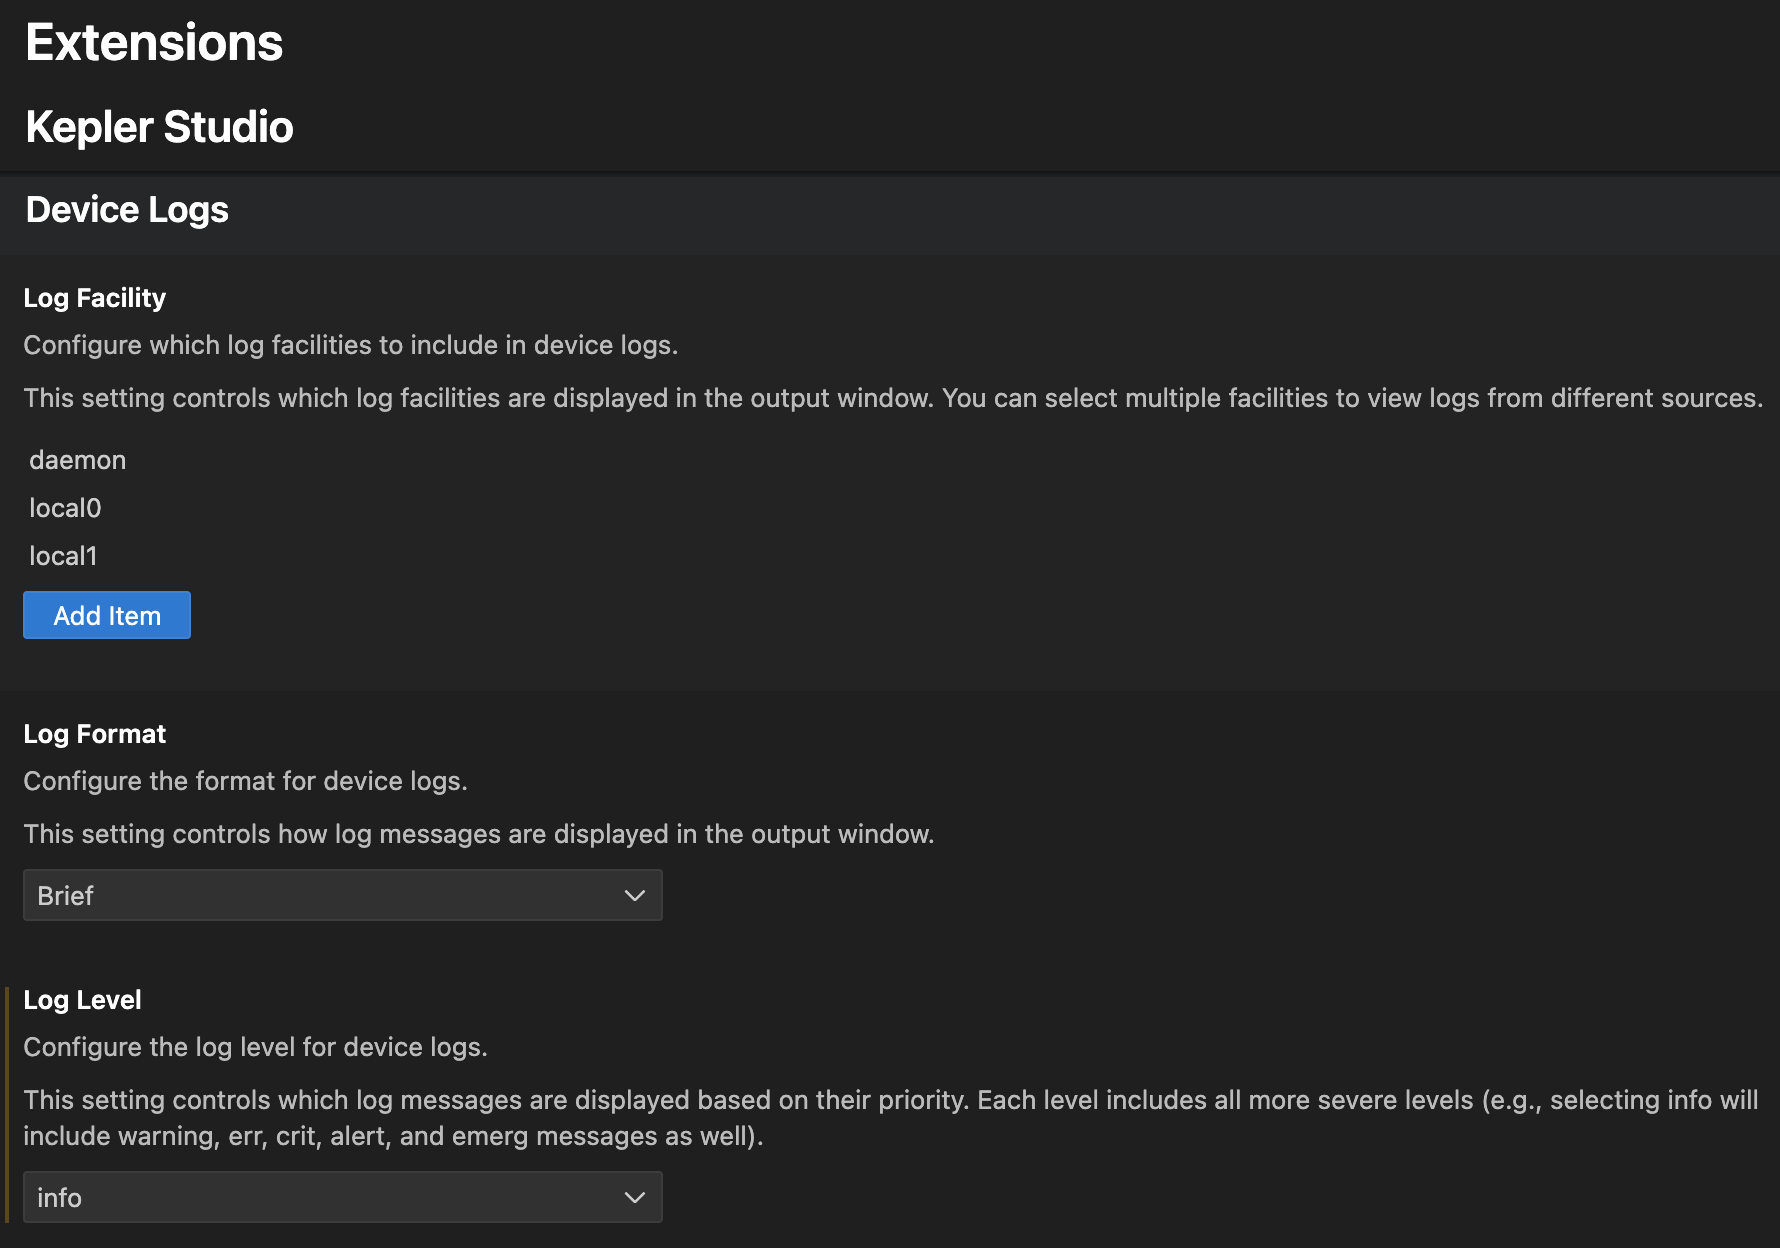
Configure log streaming settings
Adjust log streaming behavior in Vega Studio extension settings, including log facilities, format, and level. You must stop and restart log streaming for changes to take effect. See Manage System Logs for advanced configuration.
Copy device logs
Copy logs to analyze historical data, share logs with team members, or investigate issues. Use one of these options:
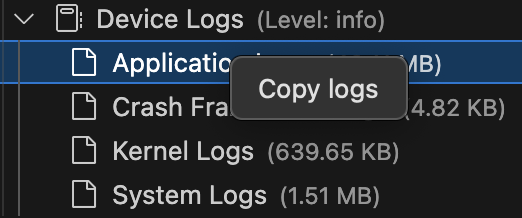
Option 1: Device Files view (Recommended)
Right-click your device in the Device Files view and select Copy logs. The system saves logs to <projectDir>/logs/<deviceName>/<logKind>/var_log/
Option 2: Command palette
- Click the Vega extension icon
 in VS Code activity bar.
 - Go to Devices section and choose your device, or enter Vega Device Management: copy logs from device in the command palette.
-
Select the logs you want to copy from the list.
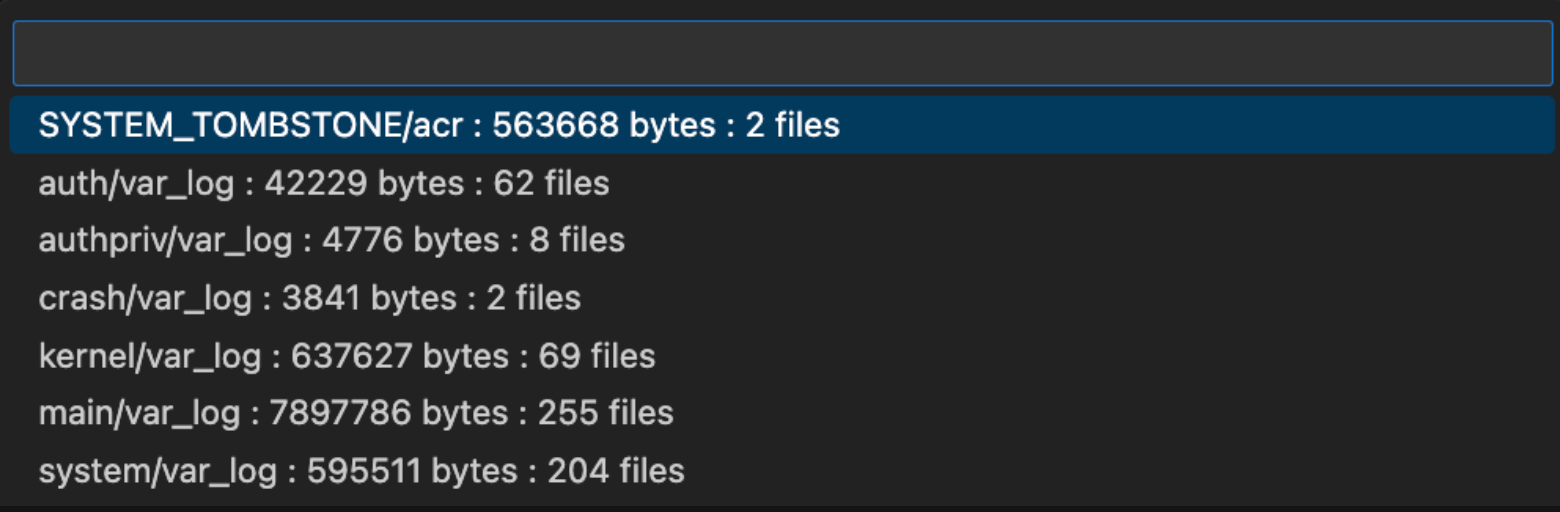
Log collection -
Check the Output channel for completion status and file paths.
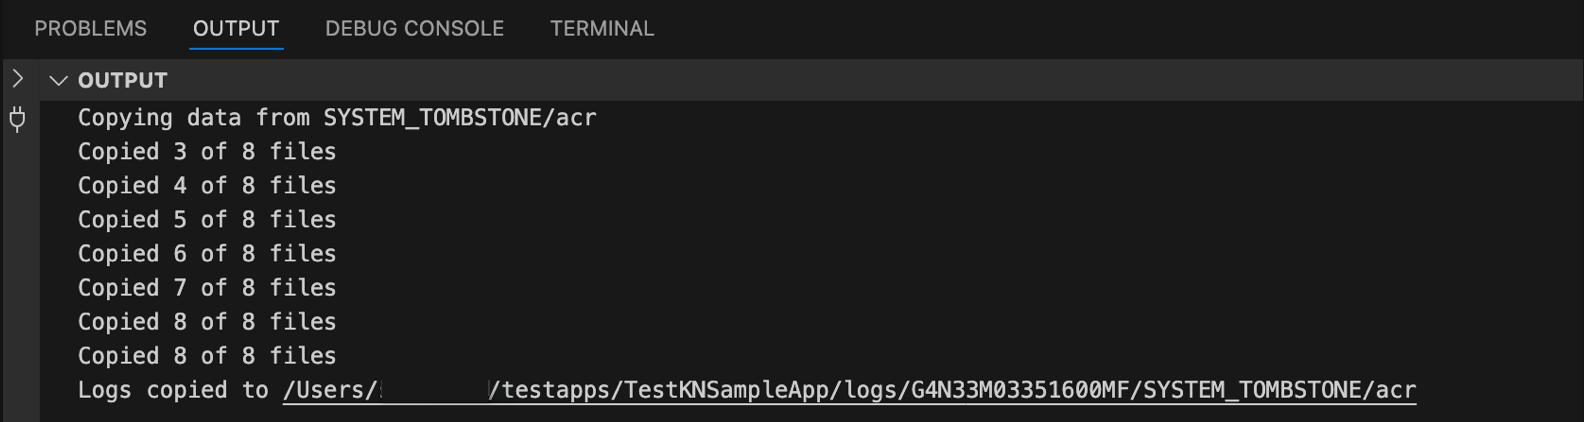
Log copy completion status
View console logs
Use console logs for React Native debugging to view your console.log() statements in real-time. These logs appear in VS Code's Output window under the React Native channel.
- Press Shift + Cmd + P (Mac) or Shift + Ctrl + P (Linux) to open the Command Palette.
- Enter Output: Show Output Channels….
- Select React Native to view your app's console logs.
Once your app runs, any console.log statements appear in this channel in real-time.
Related topics
- Use Loggingctl to Manage System Logs
- Debug App Crash Using Vega Studio
- Measure App KPIs
- Identify UI Rendering Issues
- Detect Overdraw
- Investigate Component Re-rendering Issues
Last updated: Oct 31, 2025