
Detect Memory Leaks
Memory leaks can degrade the performance and user experience of apps. The identification and resolution of these leaks is crucial for the creation of efficient and responsive apps.
Vega Studio, an extension in Visual Studio Code (VS Code) for Vega app development, has a feature called MemLab. This feature detects memory leaks in React Native for Vega apps through analysis of JavaScript heap snapshots. MemLab can identify potential memory issues, including:
- Detached Document Object Model (DOM)-like objects in the React Native virtual DOM.
- Circular references in JavaScript objects.
- Retained components or event listeners to prevent garbage collection.
React Native for Vega and its relation to React Native
React Native for Vega is a proprietary scripting language and framework developed by Amazon for building cross-platform apps. It creates efficient and responsive apps for various Amazon devices and platforms. React Native for Vega builds on React Native, inheriting many of its concepts and rules. Like React Native, React Native for Vega uses a component-based architecture and allows you to write once and deploy across multiple platforms.
Memory management in React Native for Vega
As with React Native, proper memory management is crucial in React Native for Vega apps. While the framework handles memory management, watch for leaks with long-lived objects, event listeners, and complex state.
Importance of memory leak detection
Identifying and fixing memory leaks is essential for maintaining the performance and stability of React Native for Vega apps, especially on devices with limited resources. This is where tools like MemLab help in the development process.
This page provides guidance on how to:
- Create sample React Native for Vega apps with deliberate memory leaks.
- Capture heap snapshots at different stages of the app's execution.
- Use MemLab to analyze these snapshots and identify memory leaks.
- Interpret MemLab's output to understand the nature and source of leaks.
Prerequisites
- Install Node.js.
-
Install MemLab:
npm install -g memlab
Step 1: Create a sample app
For testing purposes, create a sample app with deliberate sample leaks using the following command:
kepler project generate --template hello-world --name keplersampleapp --packageId com.amazon.keplersampleapp --outputDir keplersampleapp
Example app.js file
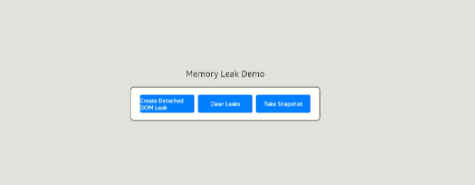
The following file shows code snippets from a sample app that demonstrates a memory leak scenario; and provides tools to create, clear, and analyze memory leaks.
  1 import React, { useRef, useState } from 'react';
  2 import { Pressable, StyleSheet, Text, View } from 'react-native';
  3
  4 export default function App() {
  5   const detachedDOMRef = useRef([]);
  6   const [snapshotInfo, setSnapshotInfo] = useState(null);
  7   const [focusedButton, setFocusedButton] = useState(null);
  8
  9   // Function to create detached DOM elements (strong memory leak)
 10   const createDetachedDOMLeak = () => {
 11     console.log('Creating detached DOM elements...');
 12     const detachedElements = [];
 13     for (let i = 0; i < 10000; i++) {
 14       // Create an object representing a detached DOM element
 15       const element = { id: i, name: `Detached Element ${i}` };
 16       detachedElements.push(element);
 17     }
 18     detachedDOMRef.current = detachedElements; // Keep reference, not in actual DOM
 19     console.log('Detached DOM leak created with 10,000 elements');
 20   };
 21
 22   // Function to clear the memory leak
 23   const clearLeaks = () => {
 24     console.log('Clearing all leaks...');
 25     detachedDOMRef.current = []; // Clear the reference
 26     console.log('All leaks cleared');
 27   };
 28
 29   // Simulate taking a heap snapshot
 30   const takeHeapSnapshot = async () => {
 31     console.log('Taking heap snapshot...');
 32     const snapshot = {
 33       detachedDOMSize: detachedDOMRef.current.length,
 34     };
 35     if (global.__CollectHeapSnapshot__) {
 36       global.__CollectHeapSnapshot__();
 37     }
 38     setSnapshotInfo(snapshot);
 39     console.log('Heap snapshot taken:', snapshot);
 40   };
 41
 42   return (
 43     <View style={styles.container}>
 44       <Text style={styles.text}>Memory Leak Demo</Text>
 45
 46       <View style={styles.boundary}>
 47         <View style={styles.buttonRow}>
 48           <Pressable
 49             onPress={createDetachedDOMLeak}
 50             onFocus={() => setFocusedButton('createDetachedDOMLeak')}
 51             onBlur={() => setFocusedButton(null)}
 52             style={[
 53               focusedButton === 'createDetachedDOMLeak' ? styles.focusedButton : styles.button,
 54             ]}
 55           >
 56             <Text style={styles.buttonText}>Create Detached DOM Leak</Text>
 57           </Pressable>
 58
 59           <Pressable
 60             onPress={clearLeaks}
 61             onFocus={() => setFocusedButton('clearLeaks')}
 62             onBlur={() => setFocusedButton(null)}
 63             style={[
 64               focusedButton === 'clearLeaks' ? styles.focusedButton : styles.button,
 65             ]}
 66           >
 67             <Text style={styles.buttonText}>Clear Leaks</Text>
 68           </Pressable>
 69
 70           <Pressable
 71             onPress={takeHeapSnapshot}
 72             onFocus={() => setFocusedButton('takeHeapSnapshot')}
 73             onBlur={() => setFocusedButton(null)}
 74             style={[
 75               focusedButton === 'takeHeapSnapshot' ? styles.focusedButton : styles.button,
 76             ]}
 77           >
 78             <Text style={styles.buttonText}>Take Snapshot</Text>
 79           </Pressable>
 80         </View>
 81       </View>
 82
 83       {snapshotInfo && (
 84         <Text style={styles.snapshotText}>
 85           Snapshot taken: {snapshotInfo.detachedDOMSize} detached DOM elements
 86         </Text>
 87       )}
 88     </View>
 89   );
 90 }
 91
 92 const styles = StyleSheet.create({
 93   container: {
 94     flex: 1,
 95     justifyContent: 'center',
 96     alignItems: 'center',
 97     backgroundColor: '#e0e0e0',
 98   },
 99   text: {
100     fontSize: 24,
101     marginBottom: 20,
102     textAlign: 'center',
103   },
104   boundary: {
105     padding: 20,
106     borderWidth: 2,
107     borderColor: '#333',
108     backgroundColor: '#ffffff',
109     borderRadius: 10,
110  },
111  buttonRow: {
112  flexDirection: 'row',
113  justifyContent: 'center',
114  },
115  button: {
116  width: 150,
117  height: 50,
118  marginHorizontal: 5,
119  borderRadius: 5,
120  alignItems: 'center',
121  justifyContent: 'center',
122  backgroundColor: '#007bff',
123  },
124  focusedButton: {
125  backgroundColor: '#003f7f',
126  color: '#000', // Black text on focus
127  },
128  buttonText: {
129  color: '#fff',
130  fontSize: 16,
131  },
132  snapshotText: {
133  marginTop: 20,
134  fontSize: 16,
135  color: '#333',
136  },
137 });
Step 2: Build your app
Run the following commands:
npm install
npm run build:app
Step 3: Run your app
-
Run the Vega Virtual Device.
kepler virtual-device start -
Run your app on the Vega Virtual Device:
kepler run-kepler <Vpkg path> <App ID> -d VirtualDevice
Step 4: Capture and copy heap snapshots
- While your app is running, click the Take Snapshot button to capture the heap snapshots on the device.
- Click the Create Detached DOM Leak button to generate 10000 memory-leaking elements.
- Retake a snapshot.
- Click the Clear Leaks button to remove the elements and simulate a memory leak.
-
Take a final snapshot.

When you click the Take Snapshot button, the logs show where the system saves the snapshot file.
ls /home/app_user/packages/<app>/data/ -l total 39764 -rw-r—r-- 1 app_user 30097 26 2024-10-17 08:56 shared_preferences.json -rw-r—r-- 1 app_user 30097 6335533 2024-10-17 08:37 snapshot-17-10-2024-08-37-08.heapsnapshot -rw-r—r-- 1 app_user 30097 8081408 2024-10-17 08:37 snapshot-17-10-2024-08-37-25.heapsnapshot -rw-r—r-- 1 app_user 30097 6336519 2024-10-17 08:39 snapshot-17-10-2024-08-39-27.heapsnapshot -rw-r—r-- 1 app_user 30097 9492333 2024-10-17 08:39 snapshot-17-10-2024-08-39-36.heapsnapshot -rw-r—r-- 1 app_user 30097 10434707 2024-10-17 08:40 snapshot-17-10-2024-08-39-55.heapsnapshot -
Copy the snapshot files to your local machine.
With the heap snapshots you've taken, you can analyze and identify potential memory leaks.
Step 5: Run MemLab
To run MemLab on snapshot, use the following command format.
memlab find-leaks --baseline <initial-snapshot> --target <post-leak-snapshot> --final <post-clear-snapshot> --trace-all-objects
When you run the command, MemLab performs the following actions:
- Loads all snapshots into memory.
- Compares the baseline and target snapshots for identification of new objects.
- Analyzes these new objects for persistence in the final snapshot.
- Traces object references for understanding of retention patterns.
MemLab command structure explained
The command memlab find-leaks is the core functionality of MemLab for identifying memory leaks.
The following are optional commands:
--baseline <initial-snapshot>- Specifies the initial heap snapshot taken before introducing any potential leak. It serves as the reference point.--target <post-leak-snapshot>- Specifies the snapshot taken after introducing the potential leak. MemLab compares this snapshot against the baseline to identify new objects that might be leaks.--final <post-clear-snapshot>- Specifies the snapshot taken after attempting to clear the leak. It helps MemLab determine if objects are truly leaking or just part of the normal app state.--trace-all-objects- Tells MemLab to trace all objects, providing a more comprehensive analysis but potentially increasing processing time.
Example MemLab output
memlab find-leaks --baseline snapshot-17-10-2024-08-27-13.heapsnapshot --target snapshot-17-10-2024-08-27-29.heapsnapshot --final snapshot-17-10-2024-08-27-52.heapsnapshot --trace-all-objects
Alive objects allocated in target page:
┌─────────┬─────────────────────────────────────────────────────────┬───────────┬───────┬──────────────┐
│ (index) │ name │ type │ count │ retainedSize │
├─────────┼─────────────────────────────────────────────────────────┼───────────┼───────┼──────────────┤
│ 0 │ 'JSArray'  │ 'object' │ 305  │ '1.1MB' │
│ 1 │ 'JSObject(id, name)' │ 'object' │ 10000 │ '1.1MB' │
│ 2 │ 'DictPropertyMap'  │ 'object' │ 79 │ '122.1KB' │
│ 3 │ 'HiddenClass'  │ 'object' │ 71 │ '92.6KB'  │
│ 4 │ 'BoxedDouble'  │ 'object' │ 1511 │ '36.2KB'  │
│ 5  │ 'JSObject(memoizedState, baseState, baseQueue, queu...' │ 'object' │ 498  │ '23.9KB'  │
│ 6 │ 'Environment'  │ 'object' │ 287  │ '14.7KB'  │
│ 7 │ 'JSFunction' │ 'closure' │ 185  │ '8.8KB' │
│ 8 │ 'JSObject(validated)'  │ 'object' │ 155  │ '7.4KB' │
│ 9  │ 'JSObject($$typeof, type, key, ref, props, ...)' │ 'object' │ 155  │ '7.4KB' │
│ 10 │ 'JSObject(tag, create, destroy, deps, next)' │ 'object' │ 132  │ '6.3KB' │
│ 11 │ 'Detached FiberNode' │ 'object' │ 12 │ '5.5KB' │
│ 12 │ 'JSObject(value, children)'  │ 'object' │ 66 │ '3.1KB' │
│ 13 │ 'HashMapEntry' │ 'object' │ 61 │ '2.9KB' │
│ 14 │ 'JSObject(style, children)'  │ 'object' │ 58 │ '2.7KB' │
│ 15 │ 'warnAboutAccessingRef'  │ 'object' │ 54 │ '2.5KB' │
│ 16 │ 'warnAboutAccessingRef'  │ 'closure' │ 54 │ '2.5KB' │
│ 17 │ 'JSObject(lastEffect, stores)' │ 'object' │ 48 │ '2.3KB' │
│ 18 │ 'HiddenClass(Dictionary)'  │ 'object' │ 45 │ '2.1KB' │
│ 19 │ 'HostObject' │ 'object' │ 43 │ '2KB' │
└─────────┴─────────────────────────────────────────────────────────┴───────────┴───────┴──────────────┘
Sampling trace due to a large number of traces:
 Number of Traces: 10100
 Sampling Ratio: 49.5%
MemLab found 5 leak(s)
Number of clusters loaded: 0

--Similar leaks in this run: 4956--
--Retained size of leaked objects: 1.1MB--
[(GC roots)] (synthetic) @3 [2.8MB]
 —-1 (element)---> [(Registers)] (synthetic) @5 [2.2KB]
 —-57 (element)---> [Environment] (object) @226263 [48 bytes]
 —-0 (internal)---> [JSObject(current)] (object) @47915 [1.1MB]
 —-directProp0 (internal)---> [JSArray] (object) @222185 [1.1MB]
 —-9999 (element)---> [JSObject(id, name)] (object) @191663 [112 bytes]
 -—class (internal)---> [HiddenClass] (object) @117709 [300 bytes]

--Similar leaks in this run: 22--
--Retained size of leaked objects: 2.9KB--
[(GC roots)] (synthetic) @3 [2.8MB]
 —-1 (element)---> [(Registers)] (synthetic) @5 [2.2KB]
 —-2 (element)---> [Detached FiberNode RCTView] (object) @69 [384 bytes]
 —-pendingProps (property)---> [JSObject(accessibilityViewIsModal, isTVSelectable, hitSlop, alexaEntityType, alexaExternalIds, ...)] (object) @228861 [680 bytes]
 —-onBlur (property)---> [onBlur] (closure) @45137 [128 bytes]
 —-prototype (property)---> [onBlur] (object) @224283 [48 bytes]

--Similar leaks in this run: 11--
--Retained size of leaked objects: 560 bytes--
[(GC roots)] (synthetic) @3 [2.8MB]
 —-1 (element)---> [(Registers)] (synthetic) @5 [2.2KB]
 —-34 (element)---> [JSObject(Dictionary)] (object) @133 [26.2KB]
 —-console (property)---> [JSObject(error, info, log, warn, trace, ...)] (object) @78609 [4.8KB]
 —-directProp1 (internal)---> [JSFunction] (closure) @87937 [256 bytes]
 —-environment (internal)---> [Environment] (object) @87913 [208 bytes]
 —-parentEnvironment (internal)---> [Environment] (object) @87801 [32 bytes]
 —-0 (internal)---> [JSObject(enable, disable, registerBundle, log, setup)] (object) @85777 [3.2KB]
 —-directProp4 (internal)---> [setup] (closure) @88235 [48 bytes]
 —-environment (internal)---> [Environment] (object) @88203 [2.6KB]
 —-11 (internal)---> [JSArray] (object) @88225 [2.1KB]
 —-4 (element)---> [JSArray] (object) @222491 [200 bytes]

--Similar leaks in this run: 1--
--Retained size of leaked objects: 64 bytes--
[(GC roots)] (synthetic) @3 [2.8MB]
 —-1 (element)---> [(Registers)] (synthetic) @5 [2.2KB]
 —-57 (element)---> [Environment] (object) @226263 [48 bytes]
 —-parentEnvironment (internal)---> [Environment] (object) @47913 [2KB]
 —-7 (internal)---> [JSObject(container, text, boundary, buttonRow, button, ...)] (object) @77759 [712 bytes]
 —-snapshotText (property)---> [JSObject(marginTop, fontSize, color)] (object) @77737 [708 bytes]
 —-class (internal)---> [HiddenClass] (object) @27707 [660 bytes]
 —-forInCache (internal)---> [SegmentedArray] (array) @224539 [64 bytes]

--Similar leaks in this run: 10--
--Retained size of leaked objects: 40 bytes--
[(GC roots)] (synthetic) @3 [2.8MB]
 —-3 (element)---> [(RuntimeModules)] (synthetic) @9 [15.4KB]
 —-378 (element)---> [, ] (symbol) @117483 [4 bytes]
Understand the MemLab output
MemLab output has the following key elements.
Alive objects allocated in the target page
This section displays objects still present in memory after app operations or changes. This list indicates potential memory retention issues and includes the following details for each object:
- name - The object name or its structural type.
- type - Whether the object is an 'object' (like JSObject, JSArray, etc.) or a 'closure' (a function that retains memory).
- count - The number of instances of each object type.
- retainedSize - The total memory retained by these objects.
Example
JSArray (Object Type)- 305 instances, retaining 1.1MB of memory.JSObject(id, name)- 10,000 instances, also retaining 1.1MB of memory.
Sampling trace due to a large number of traces
This section shows that due to 10,100 traces, MemLab used 49.5% sampling for efficient processing.
MemLab found X leaks
In the example, MemLab found five leaks. For each memory leak, the output lists:
- Number of similar leaks - How many times the tool detected a similar leak pattern.
- Retained size of leaked objects - The total memory retained by the leaked objects.
- Leak trace - Shows how object interconnect and why the garbage collector can't collect them.
Garbage Collection (GC) roots
These are the entry points for objects that remain in memory and prevent other objects from being garbage collected. The trace shows how GC roots keep objects alive through references, with paths leading back to JSObjects, JSArrays, and closure references.
Example 1
- Leak pattern: 4,956 similar leaks, retaining 1.1MB of memory.
JSObject(current) → JSArray → JSObject(id, name).
This trace shows that the JSArray is keeping references to 10,000 JSObject(id, name) objects, preventing them from being garbage collected.
Example 2
Leak pattern: 22 similar leaks, retaining 2.9KB of memory.
Traces involve a Detached FiberNode RCTView object, which is part of React Native's view system. Event handlers, like onBlur could cause the leak by unnecessarily retenting objects even after the code removes them.
Analyze the snapshot with MemLab
- Examine the Alive objects allocated in target page section to see retained objects.
- Look at the MemLab found [X] leaks line to see how many distinct leaks MemLab identified. For each leak:
- Note the number of similar leaks and total retained size.
- Examine the object trace to understand how the system retains objects.
- Pay attention to unexpected retentions, like detached DOM elements or large arrays.
Address leaks
You can address leaks in your app by performing the following actions:
- Identify patterns in leaked objects (for example, detached DOM elements, uncleared event listeners).
- Locate the corresponding code in your app.
- Implement fixes, such as properly unmounting components, clearing arrays, or removing event listeners.
Verify fixes
You can verify fixes by performing the following actions:
- Rebuild and rerun your app with the implemented fixes.
- Repeat the snapshot and analysis process.
- Confirm that the previously identified leaks are no longer present in the MemLab output.
Related topics
- 💬 Community: How to check if my app is running out of memory?
- Measure App KPIs
- Identify UI Rendering Issues
- Detect Overdraw
- Investigate Component Re-rendering Issues in React Native for Vega Apps
Last updated: Nov 13, 2025