
Performance Best Practices for Web Apps
App performance is important for a great user experience for Vega Web Apps. A well-optimized app launches quickly, responds smoothly to user input, and maintains fluid animations, playback, and scrolling throughout its lifecycle.
This page covers common best practices to help you improve the performance of your web app on Vega. Use these best practices alongside the Vega KPI Visualizer and Chrome DevTools to monitor, measure, and continuously improve your app's performance throughout development.
Use the native SplashScreen API
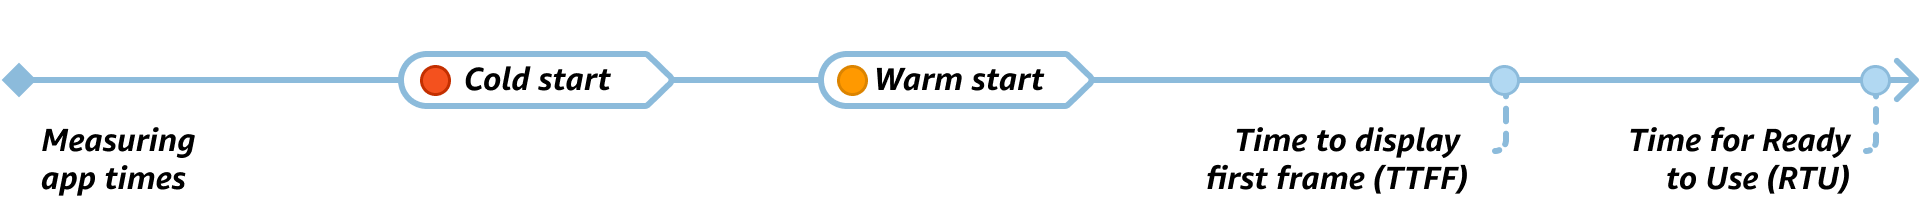
App launch performance impacts the user experience. When a user launches an app, they expect to see something on the screen almost immediately. How fast that occurs is the TTFF (Time to first frame). React Native for Vega's native SplashScreen feature displays an app specific splash screen using image assets. Users see this screen immediately when your app launches. Your app can then focus on loading content and making network calls, without wasting time rendering a JavaScript-based splash screen. You can include animation effects with a series of animated images for the splash screen.
Measure this key performance indicator (KPI) as the time it takes to launch the main component in the manifest.toml file, to the time when it renders its first frame.
The SplashScreenManager enables you to build static or animated graphics for the screen until you progress to the next screen of your app. The SplashScreen bundles assets during app packaging for the device to use for the app launch. SplashScreen removes some startup complexity while your app launches, so the startup screen displays until your app is ready for its first frame.
Implement a TTFD (Time To Fully Drawn) marker
Vega apps should meet certain performance markers during phases of the app lifecycle. One marker is TTFD (see previous image). Optimize apps to meet the TTFD marker once the app has successfully loaded and is ready for user interaction. Cool start must meet the same marker, before the app process starts, and warm start, when the app process is already running. Web apps should implement this marker in onLoad callbacks when the web app content is loaded fully.
Call the useReportFullyDrawn() method after launching and loading the web app. The wrapper has an onLoad event which triggers when the app is launched and ready. Also, call the reportFullyDrawn() method when it moves from the background to the foreground during a warm launch.
This example code calls useReportFullyDrawn(), to handle both cold start (onLoad) and warmStart (keplerAppState).
import { useReportFullyDrawn } from '@amazon-devices/kepler-performance-api';
import React, { useEffect, useState, useRef } from 'react';
import {VegaAppStateChange, useAddVegaAppStateListenerCallback, useGetCurrentVegaAppStateCallback} from '@amazon-devices/react-native-kepler';
...
...
export const App = () => {
    const reportFullyDrawnCallback = useReportFullyDrawn();
    const getCurrentVegaAppStateCallback = useGetCurrentVegaAppStateCallback();
    const addVegaAppStateListenerCallback = useAddVegaAppStateListenerCallback();
    const [appState, setAppState] = useState(getCurrentVegaAppStateCallback);

    // Use a useEffect Hook to report the fully drawn
    // post first render, and when the state changes to the foreground.
    // If the app performs additional asynchronous processing
    // to be completed before it is fully drawn, pass the
    // completion state in the array of dependencies, and check the state
    // inside the hook.
    useEffect(() => {
        const changeSubscription = addVegaAppStateListenerCallback(
            'change',
            handleAppStateChange
        );
    }, [reportFullyDrawnCallback]);

    const handleAppStateChange = (nextAppState: any) => {
        if (
            appState.match(/inactive|background/) &&
            nextAppState === 'active'
        ) {
            reportFullyDrawnCallback();
        }
        setAppState(nextAppState);
    };
    ...
    ...
    return (
        <View style={styles.sectionContainer}>
      <WebView
      .
      .
      .
      onLoad={(event) => {
          console.log("onLoad url: ", event.nativeEvent.url)
          // Hide the splash screen and render content
          SplashScreenManager.hideAsync(your.package.name).catch((e) => {
            console.error("Error while hiding splash screen: " , e) });
          // Report fully drawn only for actual page is loaded
          if("https://mywebapp.com/home" === event.nativeEvent.url)
          {
            reportFullyDrawnCallback();
          }
        }}
        />
    </View>
    );
};
For more details, see How to implement reportFullyDrawn marker for WebView Apps.
Optimize network requests
To improve web app launch performance, you must optimize network requests. You can improve launch performance by minimizing HTTP requests by combining CSS and JavaScript files where possible, using image sprites, and reducing external third-party dependencies. Enabling asset compression using Gzip or Brotli significantly decreases the payload size for text-based resources like HTML, CSS, and JavaScript. Keep in mind that image files are often already compressed, so they don't benefit from this.
<!-- Inefficient and may not be needed for all cases -->
<script src="utils.js"></script>
<script src="api.js"></script>
<scriptsrc="main.js"></script>

<!-- Optimized - as long as it can be logically combined -->
<script src="app.bundle.js" defer></script>
Leveraging modern HTTP protocols such as HTTP/2 or HTTP/3 also helps. These protocols support multiplexing, and minimize overhead by sending multiple requests concurrently over a single connection. Reducing client-side redirects also improves latency, since every redirect adds an extra round-trip, delaying the page load.
Reduce server response times
Optimizing server response time is crucial for delivering a fast and responsive user experience. One of the most effective strategies is to use a Content Delivery Network (CDN). CDNs serve static assets like images, JavaScript, and CSS files from edge locations geographically closer to the user, reducing latency. Reducing Time to First Byte (TTFB) by optimizing backend processing, such as improving database queries, reducing middleware overhead, and optimizing server logic, can greatly improve performance.
API efficiency plays a role as well. Minimizing the number of API calls, combining them when appropriate, and avoiding redundant requests can reduce network overhead. For faster content delivery, consider using Server-Side Rendering (SSR) or Static Site Generation (SSG). These web technologies pre-renders HTML on the server for faster page loads and improved First Contentful Paint (FCP). FCP is how long it takes for a browser to render the first piece of content. You can also defer loading noncritical or secondary data by using lazy loading techniques to prioritize the most essential content first.
Optimize rendering and JavaScript execution
Optimize rendering and JavaScript execution for fast and responsive web apps. One key practice is to avoid blocking the main JavaScript thread with heavy computations or unnecessary logic during page load. A blocked main thread may delay rendering with frame drops, negatively impacting the user experience.
To prevent a blocked thread, keep JavaScript lightweight and execute only the essential code during the initial load. Execute only essential code for input event handling as well. Input handlers may cause performance problems in your app's fluidity, since they can block frames from completing, and cause additional and unnecessary layout work. Debounce your handlers, meaning store event values and deal with style changes in the next requestAnimationFrame callback.
Load scripts asynchronously that aren't immediately necessary using the async or defer attributes to prevent them from blocking page rendering, which reduces the impact of render-blocking JavaScript.
// Asynchronous JavaScript loading
<script src="analytics.js" defer></script>

// Dynamic data/JavaScript importing when required
import('./data.js').then(initData);
Code splitting can load JavaScript modules dynamically, so each page or feature loads only the scripts it needs. Enable acceleration through CSS properties like transform and will-change for smoother animations and better visual performance. GPU acceleration through CSS helps offload rendering to the GPU. These strategies enhance web app perceived and actual performance.
Web Workers are another way to optimize your JavaScript, making it run in the background. For more information, see Web Worker Best Practices for Web Apps.
Cache resources
Caching enhances the performance and responsiveness of web apps. Client side caching involves setting appropriate Cache-Control headers for resources such as JavaScript files, CSS, data, and images. Caching stores and reuses web app assets instead of downloading them repeatedly. Leveraging CDN caching can also greatly improve load times by serving static content from edge locations closer to the user. By combining client and CDN caching, developers can reduce server load, decrease latency, and provide a smoother experience for end users.
Use the device hardware decoder
Modern Vega devices include dedicated hardware decoders for media playback. Leveraging hardware decoding instead of software (CPU-based) decoding significantly reduces CPU load, lowers memory usage, and improves video playback smoothness, providing better app performance.
Why it matters Software decoding is computationally expensive and can cause dropped frames during video playback, increased CPU contention that slows down other app operations, higher thermal output that may trigger device throttling, and degraded Time to First Frame (TTFF) when loading media-heavy content. Hardware decoders offload this work to dedicated silicon, freeing the CPU for UI rendering and app logic.
Recommended practices
Always use <video> elements with hardware-supported codecs. Vega devices support hardware-accelerated decoding for common supported codecs such as H.264 (AVC), H.265 (HEVC), VP8, and VP9 (varies based on device). Prefer these over software-only formats. Serve media in a format natively supported by the device's hardware decoder to avoid fallback to software decoding at runtime. Hardware decoder resources are finite, so don't create multiple <video> elements simultaneously. Where possible, reuse video elements across your app. When using the Media Source Extensions (MSE) API for adaptive streaming, make sure the segment format and codec string passed to MediaSource.addSourceBuffer() matches a hardware-supported codec. Use MediaSource.isTypeSupported() to verify support before initializing playback. Use HTMLVideoElement.canPlayType() to detect hardware decoder availability, and gracefully fall back if needed.
Avoid mixing heavy CSS animations with video playback, since both compete for GPU resources. Prefer hardware-accelerated CSS transforms to keep animations smooth without impacting playback performance.
Improve scroll performance
There are several areas to consider for improving your app's scroll performance. First, avoid frequent access or changes to layout properties, such as offsetTop and scrollHeight within scroll event handlers. Making these changes impacts performance, since the layout recalculates each time. You can also throttle or debounce mechanisms to limit the frequency of scroll event handling. It's best to avoid synchronous layout reads or writes inside scroll listeners to prevent forced reflows.
Only render visible or necessary elements, rather than everything on the page, or an entire scrollable list. It's also a good idea to use GPU-accelerated CSS properties like transform for smooth scrolling instead of CPU-heavy ones like top, left, or width.
The Rendering tab in Chrome DevTools provides visual cues to highlight layers that paint slowly or redundantly while scrolling. Use this tool to identify performance bottlenecks and optimize your scroll behavior.
Measure your web app's KPIs
Vega provides a Vega App KPI Visualizer tool to measure the key performance metrics at a high level. Use this tool to measure Time To First Frame (TTFF), Time To Fully Drawn (TTFD), scroll fluidity, and video fluidity metrics. For more details, see Measure App KPIs.
To view more detailed, lower level performance aspects of your web app, Chrome DevTool (CDT) shows you lower level performance aspects of your web app. Some Chrome tools include the Performance Tab, Network Tab, and Lighthouse to audit benchmarks, and identify web app hotspots (HTML/JS/CSS/Images) so you can improve your app's performance. Lighthouse doesn't currently work in Vega, so you can load your web app directly in Desktop Chrome and debug with the appropriate network and CPU restrictions.
Related topics
- Overview of Vega Web Apps
- Development Best Practices for Web Apps
- Web Worker Best Practices for Web Apps
- WebGL Best Practices for Web Apps
Last updated: May 01, 2026