
Monitor and Record Memory
Memory Monitor, a tool within Vega Studio, provides visibility into your app's memory usage through a graphical interface. It helps you identify and resolve memory issues before they cause performance problems: crashes, freezes, or jittering. With Memory Monitor, you can capture a snapshot of your app's memory state, and then analyze it in a recording view. The recording view highlights high memory consumption areas, enabling performance optimization by addressing inefficiencies.
This page explains how to use Memory Monitor, record app memory breakdown, and analyze recorded data using the Visual Studio (VS) Code command palette.
Inspect your app with the Memory Monitor in VS Code
-
Open the command palette in VS Code.
Mac:
Shift+Command ⌘+PLinux:
Ctrl+Shift+PNote: You can only open one project at a time.
-
Enter Vega: Start Memory Monitor and press return for Mac, or Enter for Linux.

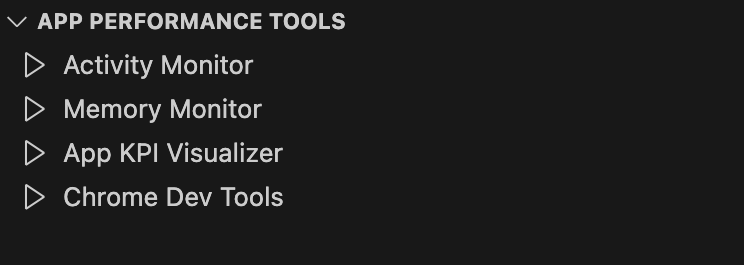
You can also select the Memory Monitor from the App Performance Tools section.
Your screen displays the Memory Monitor view. If you see a blank screen, close the window and restart the Memory Monitor.
-
Launch your app on the connected device and start Memory Monitor.
You see a progress bar opens in a new window then the live rendering of the Memory Monitor chart starts.

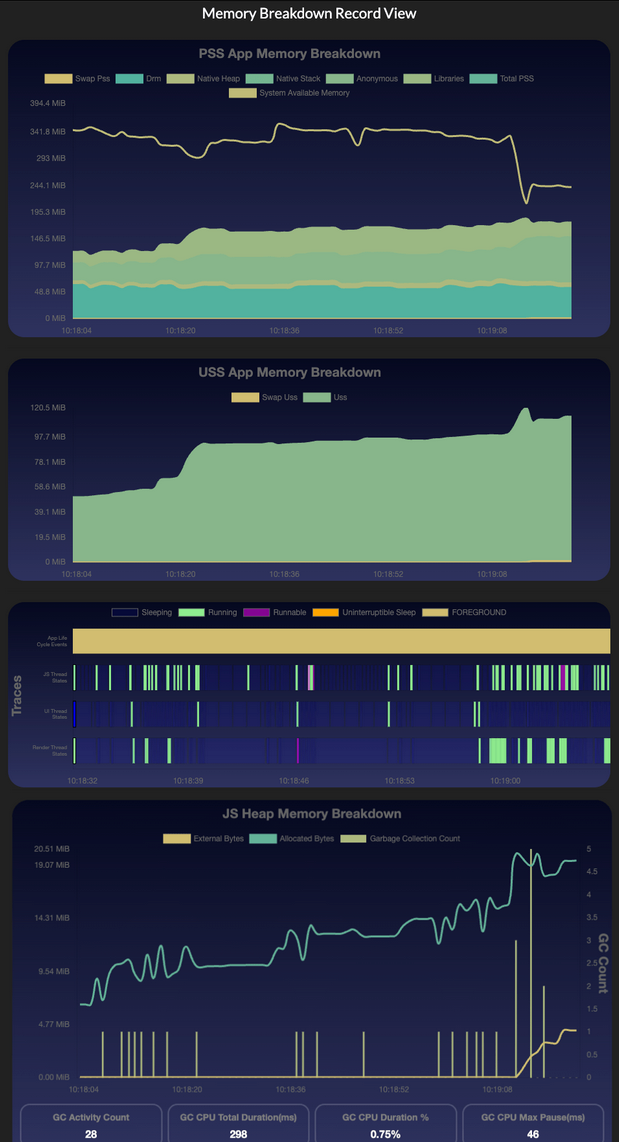
The view shows the following memory breakdowns:
- Proportional Set Size (PSS)
- Unique Set Size (USS)
- JavaScript (JS) Heap (only for React Native for Vega apps)
PSS indicates overall memory use, while USS shows private memory use. Increasing USS over time may signal a memory leak.


Inspect your app using CLI
Use the Vega Studio app performance CLI command, vega exec perf memory-monitor.
vega exec perf memory-monitor
            --app-name=com.amazondeveloper.keplervideoapp.main
             --keplerscript-app (if applicable)
             --relative-gc-count (if applicable)
See Vega Studio App Performance CLI for other command options.
Memory components
The following table describes the memory sub-components for PSS, USS, System Available Memory, and JS Heap.
| Memory component | Memory sub component | Description |
|---|---|---|
PSS |
The memory used by a running process, combining its private memory and its share of memory shared with other processes. | |
Swap PSS |
The original size of pages swapped into compressed RAM (ZRAM), measured in PSS before compression. | |
DRM |
The portion of memory allocated by the Direct Rendering Manager (DRM) for managing graphics and display operations, including graphical processing unit (GPU) and frame buffers. | |
Native Heap |
The native heap part of PSS represents allocated memory for the process using a system allocator (like malloc), specifically for allocations smaller than the memory-mapped access protocol (MMAP_THRESHOLD). Larger allocations go through MMAP instead. | |
Native Stack |
The native stack part of PSS. |
|
Anonymous |
When a process must allocate memory, it uses functions like malloc() to allocate the required amount of memory. For memory allocations that exceeds the MMAP_THRESHOLD, the process uses the mmap() system call to allocate the memory. MMAP allocations occupy this section of PSS memory. |
|
Libraries |
The contribution of PSS from loaded shared libraries. |
|
System Available Memory |
The total memory available for allocation by the OS when processes request it through malloc() or similar APIs. It also includes the memory that an OS can reclaim from an existing process/app. | |
USS |
The private portion of RAM used by the app. A continuous increase in USS over time often indicates a memory leak. Use additional monitoring metrics for a conclusive leak detection. | |
Swap USS |
The original, uncompressed size of memory pages swapped into ZRAM, measured as USS, regardless of their compressed storage size. | |
JavaScript Heap |
The memory used by the Hermes JS engine for JavaScript objects and runtime data. | |
Allocated Bytes |
Shows the total memory allocated on Hermes heap for JavaScript objects and values, indicating your JS code's actual memory usage. | |
External Bytes |
The memory used by external resources managed by Hermes' Garbage Collector (GC). | |
Number of GC Events |
The number of garbage collection cycles performed by Hermes GC. | |
GC CPU Total Duration |
The total CPU time (in milliseconds) spent on garbage collection. | |
GC CPU Duration % |
The percentage of CPU time used for garbage collection, showing memory management overhead. | |
GC Max Pause Time |
The longest GC pause (in milliseconds) since app launch, indicating the maximum delay caused by memory cleanup operations. |
Record your app memory breakdown
You can capture data for a specific period of time you want to analyze.
- In Memory Monitor, select ⏺️ Start Recording.
- Enter a name for your recording session when prompted.
- Enter the recording timeout when prompted. By default, the recording timeout is 120 seconds.
- On your Fire TV Stick, run your app in "release" mode.
-
To end the session, select ⏹️ Stop Recording.
The Recording View opens in a separate window.
Analyze your recorded data
The recording view helps you analyze your recorded performance data in detail. When you open the view, it shows multiple breakdowns and visualizations:
- Timeline
- PSS
- USS
- Traces
- JS Heap
- GC summary
You must monitor GC activity closely for the following reasons:
-
Frequent GC runs show your app dedicates excessive time to memory management instead of focusing on core tasks. This excessive memory management impacts your app's performance, making it run slower and respond less quickly to user interactions.
-
During Stop-the-World (STW) events, the GC temporarily freezes your app to free up memory. The pauses interrupts app responsiveness because the app stops processing user input during GC.
Open a previous recording
You can use one of the following options to open a previous recording: Quick open or the VS Code command palette.
Option 1 (Preferred): Use Quick open
This method provides access to your recordings through VS Code's interface or CLI.
From VS Code:
-
Find the memory monitor recording file (example:
Basic-memory-recorder[timestamp].json) using VS Code Quick Open or in the project'sgenerateddirectory. -
Click the file once to preview or twice to open in active mode.
From CLI:
Open a terminal window and enter:
code <<path-to-recording-file>>
If your terminal doesn't recognize the code command:
- Open VS Code.
-
Open the command palette:
- Mac:
Cmd+Shift+P - Linux:
Ctrl+Shift+P
- Mac:
- Run "Shell Command: Install code command in PATH".
-
Retry the command.
code <<path-to-recording-file>>
Option 2: Use VS Code command palette
This method provides access to your recording using VS Code's built-in command interface or if Quick Open isn't available.
- Open VS Code.
-
Open the command palette:
- Mac:
Cmd+Shift+P - Linux:
Ctrl+Shift+P
- Mac:
- Enter Vega: Open Recording View.
-
From the list, choose a previous recording session.
The session’s Recording View opens in a new window. If you have a current session in another tab, the focus is on the new session.
Related topics
- App Performance Best Practices
- Measure App KPIs
- Identify UI Rendering Issues
- Detect Overdraw
- Investigate Component Re-rendering Issues
Last updated: Nov 14, 2025