
Use React DevTools to Inspect Component Rendering
React DevTools helps you debug and profile React component rendering in your Vega apps. It provides:
- A component inspector to examine hierarchy, props, and styles.
- A built-in profiler to analyze component re-rendering and its causes.
This page explains how to install, configure, and use React DevTools with your Vega apps.
Prerequisites
- Three terminal windows with the Vega SDK environment script sourced.
- A Vega app project configured for debug builds.
For set up instructions, see Install Vega SDK and Build a Vega App.
Set Up React DevTools
-
Install React DevTools globally.
npm install -g react-devtools@6.0.1 -
Forward the required ports to activate connectivity.
React DevTools connects through port 8097, while the React Native packager uses port 8081.
vega device start-port-forwarding -p 8097 -f false -d <<Device_Serial_Number>>
vega device start-port-forwarding -p 8081 -f false -d <<Device_Serial_Number>>
For Vega Virtual Device testing, use VirtualDevice as «Device_Serial_Number».
-
Launch the React DevTools.
npx react-devtools -
Start the React Native packager in your project directory.
npm start -
Run the debug version of your app.
vega run-app <<PATH_DEBUG_VPKG>> <<INTERACTIVE_COMPONENT_ID>>React DevTools connects when your app loads. Press r in the packager terminal to reload if needed.
Inspect and debug your app
React DevTools provides two main interfaces to help you inspect and debug your app.
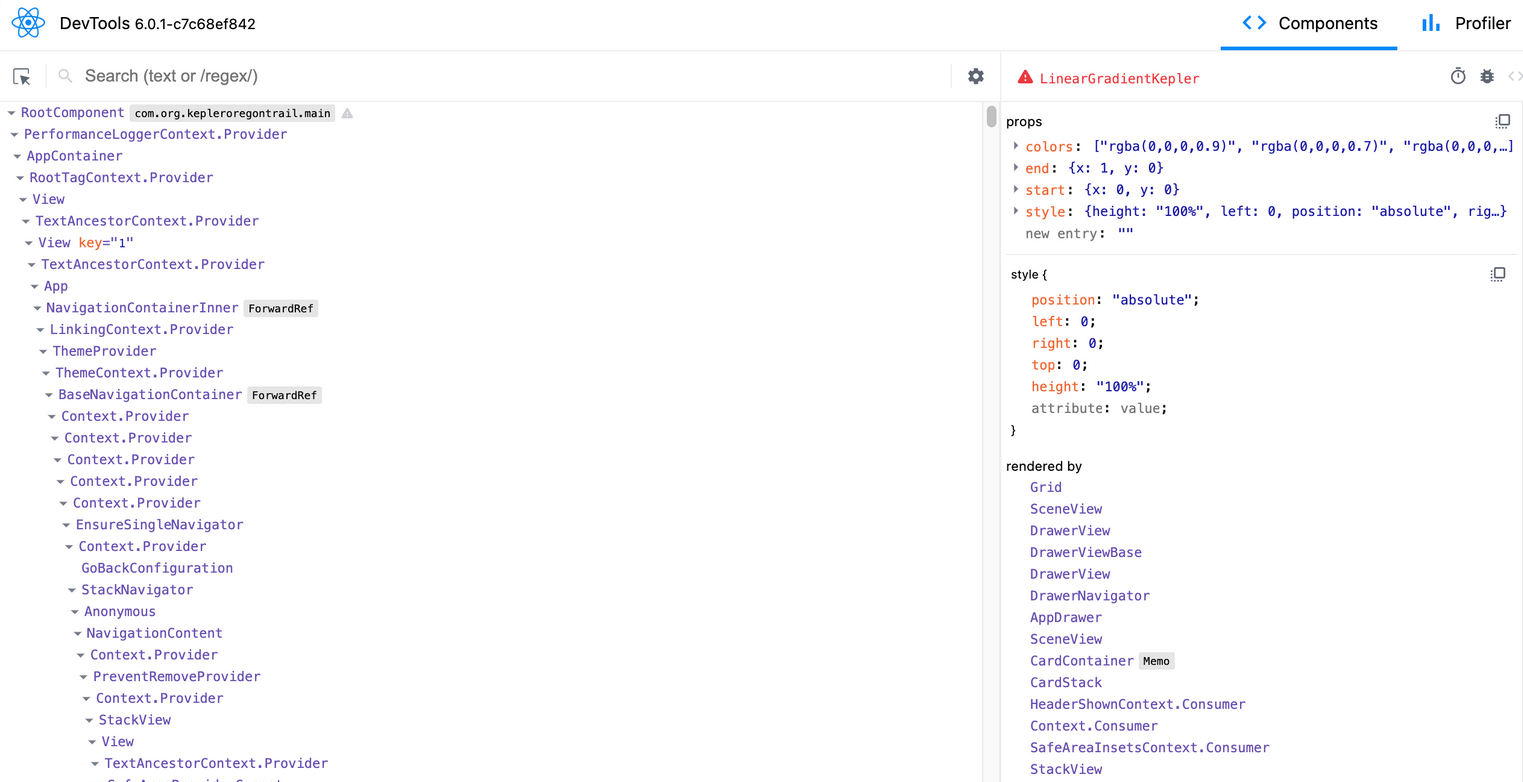
Examine components
Use the Components view to examine your component hierarchy, props, and styles.
Monitor performance
The Profiler view displays rendering metrics and component performance.
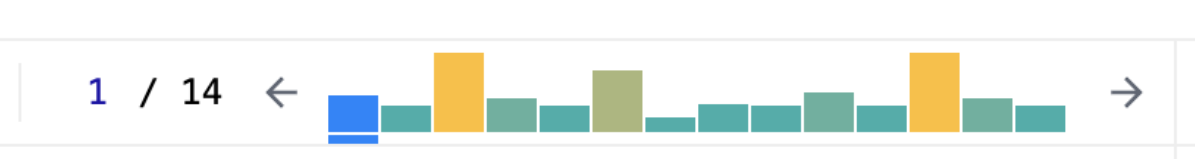
The chart shows the React commit cycles. Select a bar to inspect the components rendered in a specific cycle.
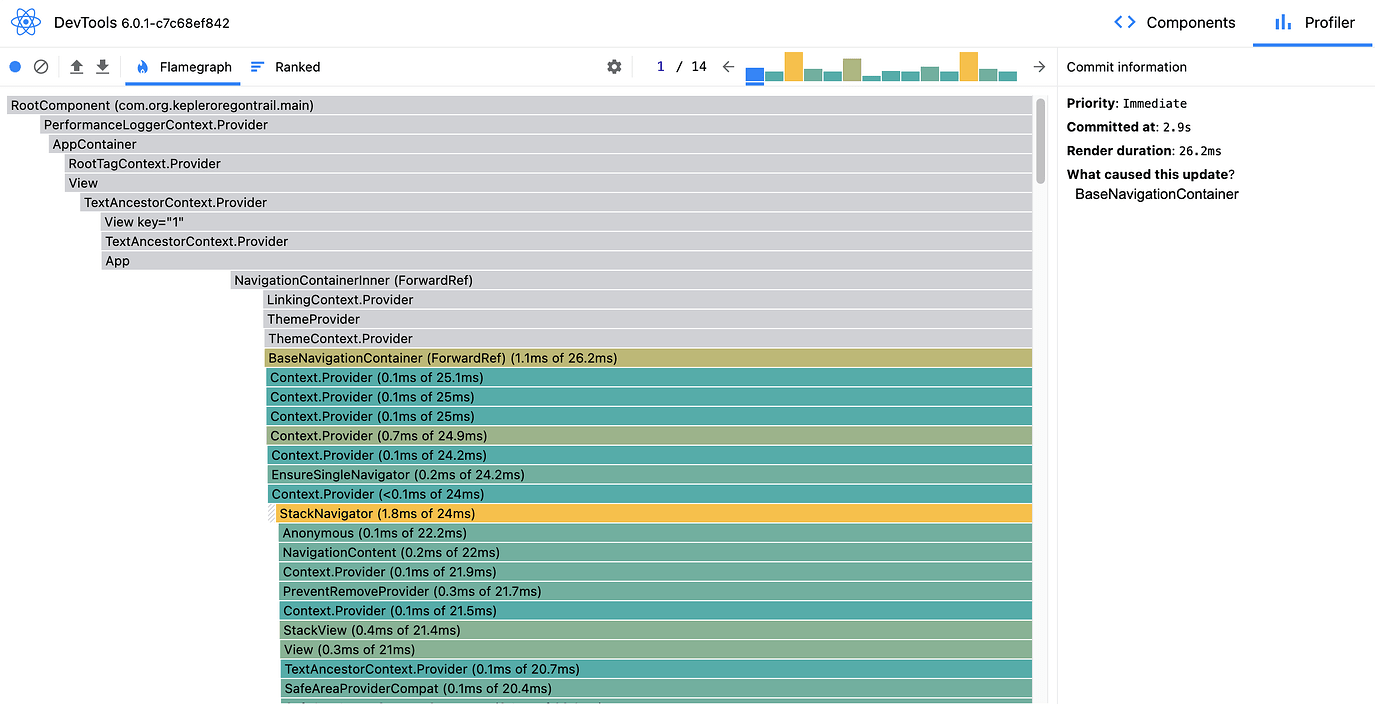
Use the Flamegraph view to inspect rendering time and hierarchy.
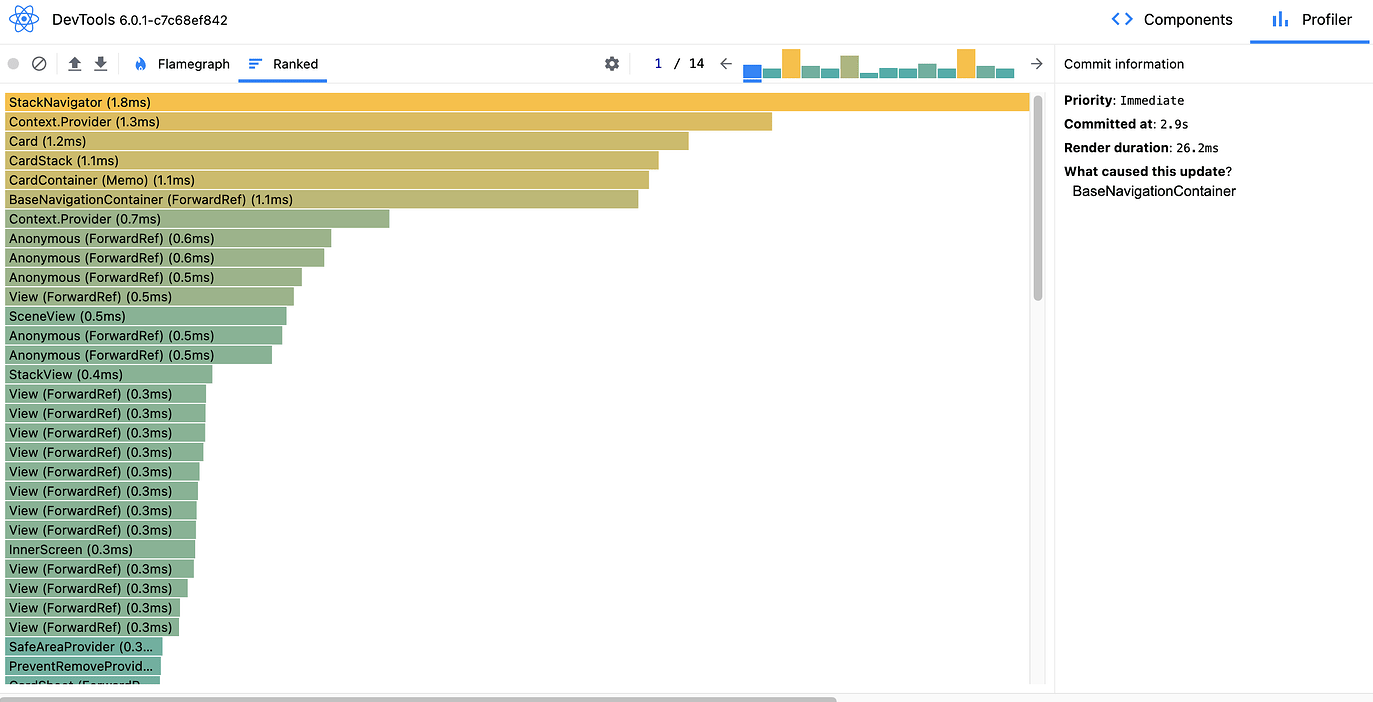
Use the Ranked view to see components ordered by render time.
Related topics
Last updated: Sep 30, 2025