
Debug App Crash Using Vega Studio
With Vega Studio, you can collect and analyze aggregated crash report (ACR) for your app running on your Fire TV Stick (device) or Vega Virtual Device (simulator). The process involves copying an ACR and symbolicating an ACR. You can collect and analyze reports for React Native for Vega apps and Turbo modules.
- Memory addresses where the crash occurred
- Stack traces showing the call hierarchy leading to the crash
- System information including device state and app version
- Raw crash data requiring symbolication to become readable
Crash debugging with ACRs works for React Native for Vega apps and Turbo modules running on Fire TV Stick devices or Vega Virtual Device simulators.
This page walks you through copying ACRs from your device and symbolicating them (converting cryptic memory addresses like 0x7ff8123456ab into readable code references like my_function.ts:42) to pinpoint exactly where and why your app crashed.
Prerequisites
- An ACR file that your app generated when it crashed.
- Debug symbols or source maps (depending on code type).
-
Install
libpython3.8on your machine if developing on Ubuntu 22.04 or higher:sudo add-apt-repository ppa:deadsnakes/ppasudo apt updatesudo apt install libpython3.8-dev -
Binutils installed:
On Mac, run:
brew install binutilsFollow the on-screen instructions.
On Ubuntu, run:
sudo apt install binutils
Copy an ACR
-
Connect your target device to your computer.
Vega displays connected devices in the sidebar. If you don't see your device, click the Refresh devices button. If you haven't connected a device, Vega selects the Vega Virtual Device by default.
-
Choose the desired target device from the sidebar.
-
Open the command palette in VS Code:
- For Mac:
Shift+Command ⌘+P - For Linux:
Ctrl+Shift+P
- For Mac:
-
Enter Vega Device Management: Copy ACR from device.
-
Enter the
package idfor your app orprocess idfrom the device or simulator.You can find the information in the
[package]section on the manifest.toml.The
package ididentifies your app while theprocess ididentifies the specific process running your app. -
If the system finds multiple ACRs, you have two options:
- Select All to download all available ACRs.
- Select latest to download only the newest ACR.
Proceed with the download using the identified process or package ID, and your selected ACR option.
-
Save the ACR to your preferred folder.
Symbolicate an ACR
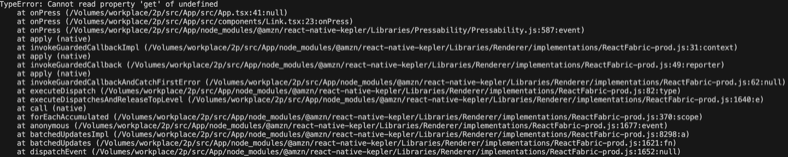
When your app crashes, it generates an ACR containing memory addresses and stack traces. These traces are difficult to read because they show only memory locations instead of actual code references.
Symbolication converts these cryptic memory addresses into readable information, showing you the exact files and line numbers where the crash occurred.
Example:
Before symbolication: 0x7ff8123456ab
After symbolication: my_function.ts:42
Launch symbolication
-
Open the command palette in VS Code:
- For Mac:
Shift+Command ⌘+P - For Linux:
Ctrl+Shift+P
- For Mac:
-
Enter Vega Device Management: Symbolicate ACR and press Enter.
-
Select your ACR file.
Select a symbolication option
Vega Studio prompts you to select a symbolication option. But before you select a symbolication option, check your package.json to validate your build configuration.
If you use custom logic instead of react-native build-kepler to generate JS Hermes bytecode bundles or JS sourcemaps, follow these steps:
- Proceed to Option 2: Manual symbolication.
-
Make sure your Metro-generated files follow these naming conventions:
- JS plain-text bundle: index.bundle
- JS source map: *.bundle.map


Option 1: Automatic symbolication
Vega Studio collects all required configuration parameters without your input. When finished, a symbolicated call stack appears in the terminal. For native code, a GDB debugging session opens automatically.
- Wait for Vega Studio to collect parameters.
-
If prompted for any missing parameters:
- Read the request carefully.
- Enter the requested information.
- Click Continue.
For example, during automatic native symbolication, if no device connects, a prompt asks you to provide a
debug rootfs. -
View results:
- Check symbolicated call stack in the terminal.
- For native code, a GDB debugging session opens automatically.
-
View the ACR:
-
For native code: The system generates an ACR report automatically when you close the GDB debugging session.
-
For JavaScript code: The system generates an ACR report automatically.
-
Vega Studio opens the ACR report automatically, showing processed information to help you diagnose the crash.
-
Option 2: Manual symbolication
In manual mode, Vega Studio analyzes your ACR to detect code types:
-
Wait for code type detection:
- Native code only - Starts native workflow.
- Mixed (native and JavaScript code) - Prompts you to select a decode type.

-
Select a decode type (if the system detects mixed code types).
Option 1: gdb (native mode) - Symbolicates native call stack.
If this option is your decode type, see Native mode for additional steps.
Option 2: js (JavaScript mode) - Symbolicates JavaScript call stack.
If this option is your decode type, see JavaScript mode for additional steps.

Native mode
-
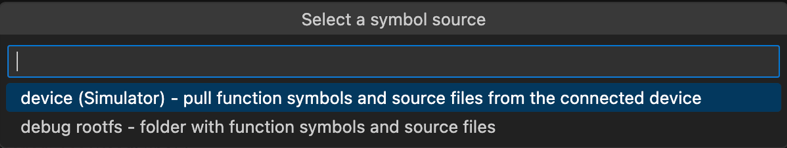
Select a symbol source:
If your device connects:
- Device - Pulls symbols and libraries from the connected device.
- Debug rootfs - Vega Studio prompts you to provide the
debug rootfs.
If your device doesn't connect, you must provide a
rootfslocation when prompted.Note: A debug rootfs is a Linux filesystem version with debugging symbols for troubleshooting apps.
-
Add additional debug symbol folders:
a. Select Yes to add a folder.
b. Select folder location.
c. Repeat or click No to finish.

-
View results:
a. Look for symbolicated call stack in the terminal.
b. Use a GDB debugging session.
-
View the ACR:
When you close the GDB debugging session, the system generates an ACR and opens it in Vega Studio. The report contains processed crash information to help you diagnose the issue.


JavaScript mode
-
Provide a source map.
a. Wait for source map prompt. b. At the prompt, click Browse. c. Navigate to the project folder. d. Select
index.bundle.map. -
Add additional maps (optional).
a. At the prompt, select Yes to add more maps. b. Select map file location. c. Repeat or select No to finish.

-
View symbolicated call stack in the terminal.
-
View the ACR.
The system generates an ACR report and opens it in Vega Studio automatically. The report contains processed crash information to help you diagnose the issue.
Common ACR issues
If you encounter issues when analyzing ACRs, see Fix Crash Analysis Issues.
Related topics
- 💬 Community: Vega supported libraries and services
- Fix Crash Analysis Issues
- Measure Performance with Chrome DevTools
- Monitor Network Traffic with Charles Proxy
Last updated: Nov 03, 2025