
Monitor CPU Usage
CPU usage directly impacts your app's performance and user experience. To help you track and optimize CPU consumption, Vega Studio offers the following monitoring tools:
- Activity Monitor - Provides real-time CPU metrics and recording capabilities (Fire TV Stick only).
- Recording View - Enables filtered data analysis and lifecycle event tracking.
Use these tools to identify performance bottlenecks and resolve CPU-intensive issues before they affect your users.
Prerequisites
Make sure you have:
-
A working app. See Build Your App for instructions on building an app.
-
Connect your app on your device.
Start the Activity Monitor
- Launch your app on the connected device.
-
Open the command palette in Visual Studio (VS Code).
Mac: Shift+Command ⌘+P
Linux: Ctrl+Shift+P

-
Enter Vega: Start Activity Monitor and press return for Mac, or Enter for Linux.
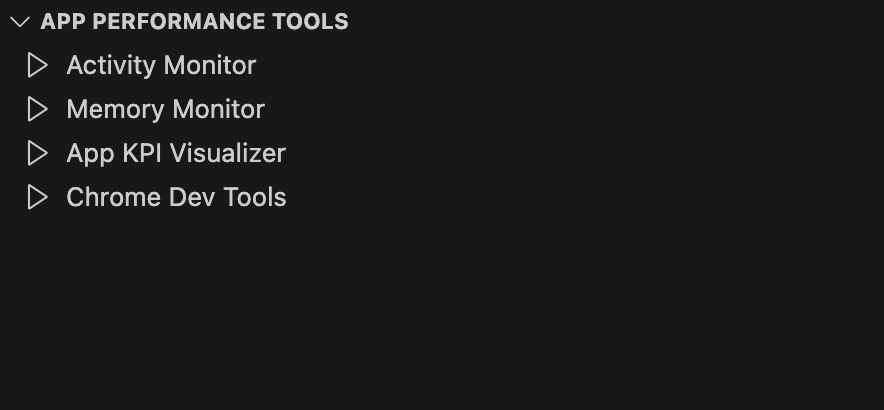
You can also select Activity Monitor from App Performance Tools.

- If you don't see a progress bar, close the window and restart the Activity Monitor.
-
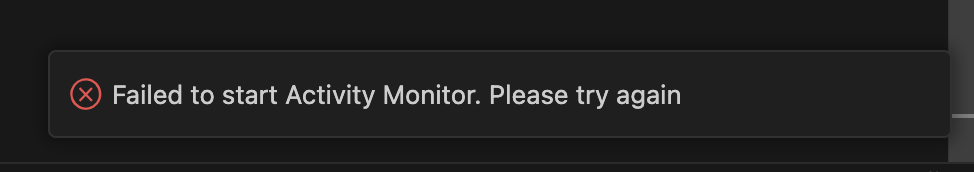
If an error occurs, you see this message:

-
Close the message and restart the Activity Monitor.
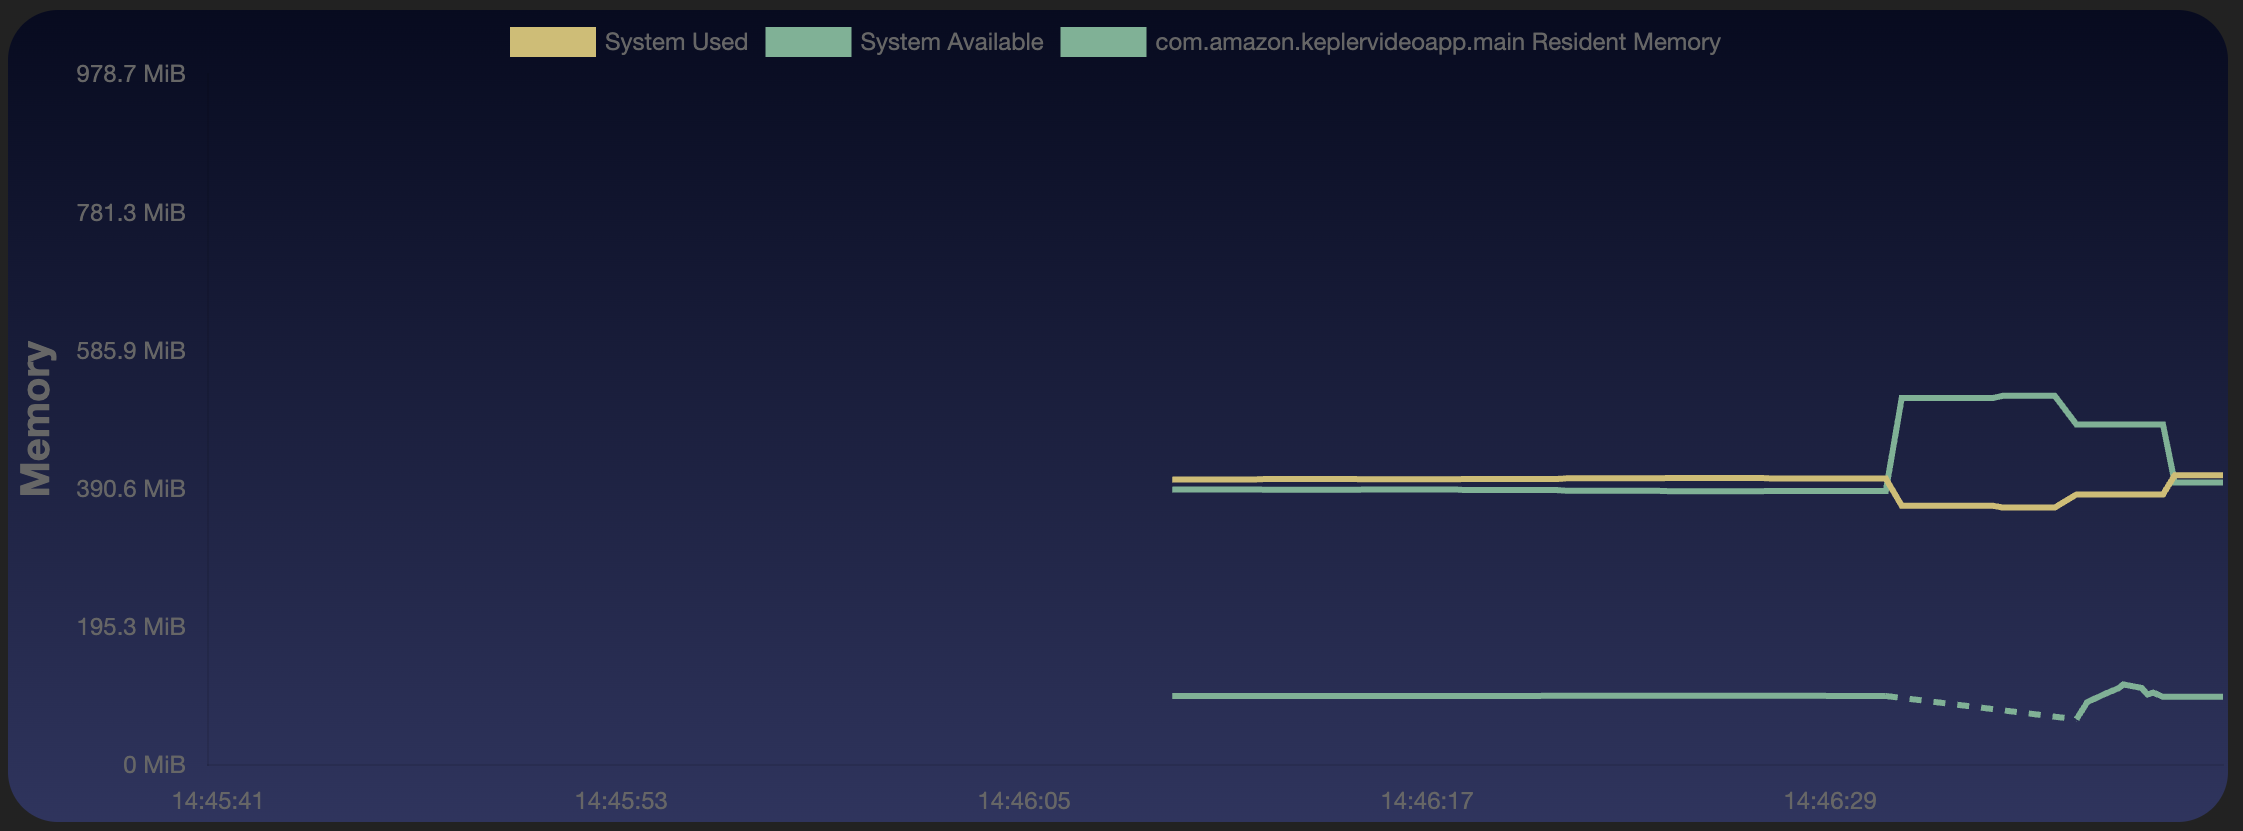
The Activity Monitor displays two time-series graphs:
- CPU utilization
- Memory usage
On both graphs, the x-axis represents a continuous time window, allowing correlation of activity across data streams.

The y-axis of the CPU utilization graph shows real-time CPU usage over time across all cores on the device.
Note: CPU utilization of 400% indicates full usage across four cores.
The memory graph's y-axis displays current memory consumption in mebibytes (MiB) over time.
A dotted line in the performance graphs shows when the app was down between crash and restart. It means data was only recorded while the app was running. If your app crashes, Activity Monitor stops collecting data. Relaunch your app to resume monitoring.

-
Enter Vega App: Run in the command palette.
You can also navigate to the Vega Studio > Projects section. It displays your app name with build, up arrow, and play icons.
- Select the play icon.


Start recording
- In Activity Monitor, select ⏺️ Start Recording.
- Enter a name for your recording session when prompted.
- Enter the recording timeout when prompted. By default, the recording timeout is 120 seconds.
- On your Fire TV Stick, run your app in "release" mode.
-
To end the session, select ⏹️ Stop Recording.
The Recording View opens in a separate window.
Run launch mode recording
This feature captures CPU, memory consumption, traces, and CPU Profiler data during app launch. Use this data to identify functions you can optimize for faster launch times. Before you use this feature, make sure you have react-native.config.js in your app project, with project and kepler in it:
   module.exports = {
	   project: {
	      kepler: {
	      }
	   },
   };
- Connect your Vega device to your development machine.
-
Run your app on a Vega device.
Follow the steps in Run your app on Fire TV Stick.
-
In the Vega Studio panel:
- Select
Releasefrom Build Modes. - Choose a device to connect from Devices.
- Select
-
Open the command palette:
Mac: Shift+Command ⌘+P
Linux: Ctrl+Shift+P

-
Enter Vega: Run CPU Profiler on App Launch and press return for Mac, or Enter for Linux.
A screen displays a progress notification during the configuration, build, installation, recording, and app launch.
When the process completes, Vega generates an app
vpkg(Vega's package format for app distribution) with a configuration for launch mode profiling. It then installs this package on the device. After installation, the Activity Monitor opens in a new window and begins recording the profiling data.

End recording session
Select Stop Recording in the Activity Monitor window.

The Recording View opens in a separate window.
Rerun launch mode recording
-
Enter Vega: Start Activity Recording and Launch App in the command palette to rerun launch mode recording with the same app build.
-
If you change your app code, rerun the launch mode recording by entering Vega: Run CPU Profiler on App Launch instead.
Analyze your recorded data
You can analyze your recorded data in the Recording View. It includes the timeline, CPU %, memory, traces, and time-based flamegraphs.

Timeline
The timeline lets you filter the data based on a selected time window.

- Drag the green timeline bar with your mouse to select a time window.
- Filter individual charts, such as: Profiler Graph and CPU Graph. Time window selection within an individual chart only affects the selected chart.
Traces
Traces provide visibility into your app lifecycle events and thread states information.
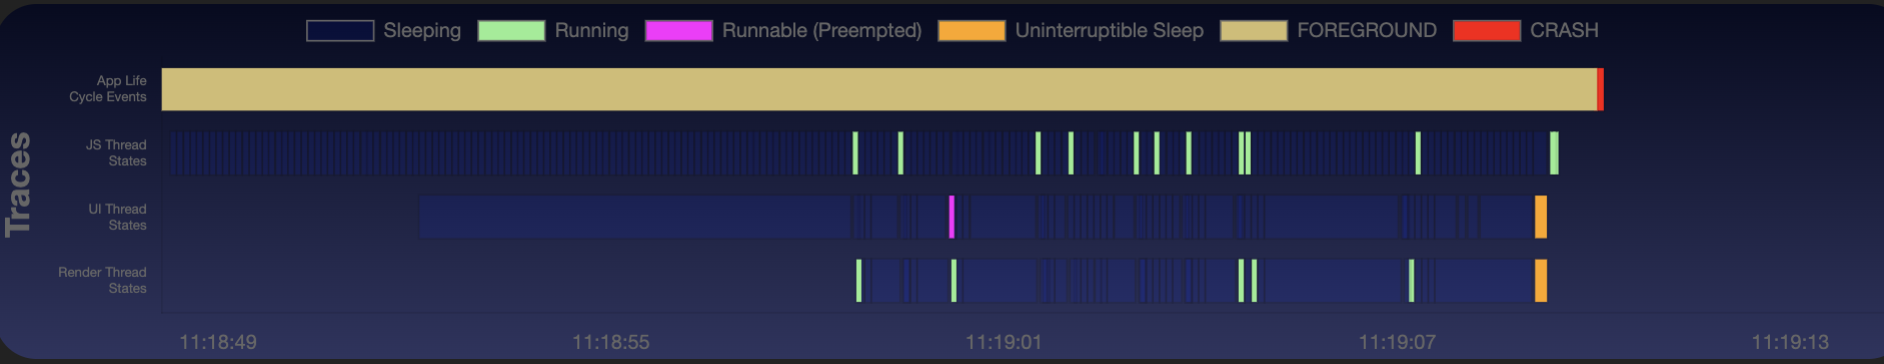
App lifecycle events
The app lifecycle provides context around your app's state, such as:
- Launch - The app starts and moves to foreground when it becomes visible on screen.
- Foreground - The app is visible on the screen.
- Background - The app isn’t visible on the screen, but is running in the background.
- Crash - The event shows an app crash.
When an app crashes during monitoring, Activity Monitor performs these actions:
- Downloads the corresponding Aggregated Crash Report (ACR) for the crashed app. An ACR contains detailed information about the crash, which can help in diagnosing and fixing the issue.
- Sends a notification to the VS Code workspace, which appears in the bottom-right corner of the VS Code window. The notification includes two action buttons: Symbolicate an ACR and View and Copy Logs.
Thread state information
The thread state information shows:
- The predominant thread state for each 100-ms interval.
- Where the threads spent the most time during the entire recording session.
Thread types
The following are the various threads types:
- JS Thread - Runs all JavaScript logic, event handlers, and scripts on a single thread. Long-running operations block UI and rendering tasks, causing performance issues, such as: UI unresponsiveness, animation delays, high latency
- UI Thread - Updates interface elements and handles user interactions like clicks and key presses. Blocking this critical thread makes your app unresponsive.
-
Render Thread - Creates and manages all visual elements, working with the UI thread to deliver graphical output.
Use thread state information to find performance bottlenecks in your JavaScript apps. See common scenarios in Investigate JavaScript Thread Performance.
Thread states
The following are the various thread states:
- Running - Thread actively executes instructions on a CPU core.
- Runnable - Thread stands ready to run and waits for a CPU core.
- Runnable (Pre-empted) - Scheduler pre-empted the thread to let another thread run, showing CPU contention.
- Sleeping - Thread voluntarily yields control, letting other threads use the CPU to help manage resources.
- Uninterruptible Sleep - Thread executes a kernel syscall and can't accept pre-emption.
- Stopped - Thread pauses (often for debugging or synchronization) and can resume later.
- Idle - Thread waits for work assignment and performs no tasks.
- Exit - Thread completes execution and terminates, can't resume.
Hot functions
During recording, hot functions show which parts of your code consume the highest amount of CPU time, including time spent in child functions (inclusive time).
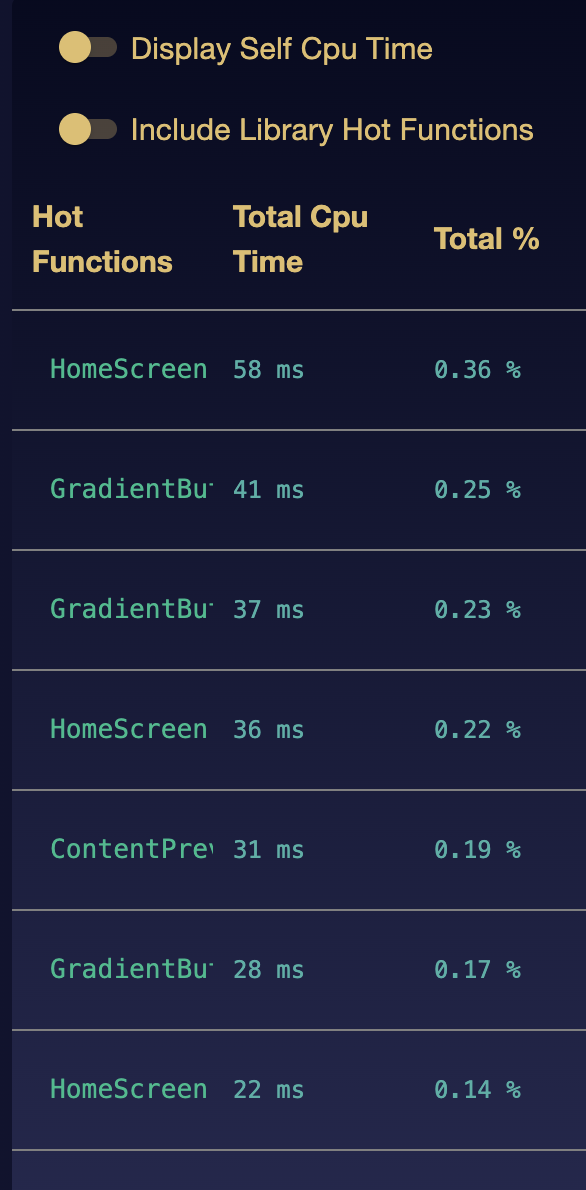
The Recording View displays a table of hot functions:
-
Hot Functions - Function name and source position. Navigate to function source code by selecting the
Hot Functionslink. -
Total CPU Time - Total time, inclusive in milliseconds (ms), spent in function execution throughout the recording session.
-
Self CPU Time - Total time, exclusive in milliseconds (ms), spent in function execution throughout the recording session.
-
Total % - Percentage of total CPU-time inclusive spent in this function.

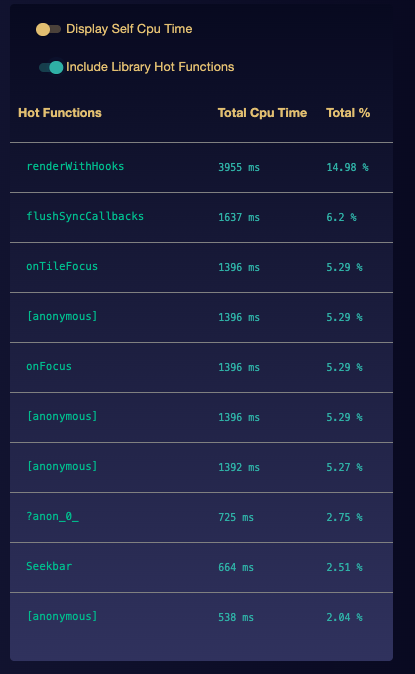
By default, only the hot functions from your app display in the hot functions table. To observe hot functions from third-party libraries, toggle the
Include Library Hot Functionsoption.Important: Some Library Functions may not be inspectable due to having@amzn/in their paths. To inspect, refer to the corresponding@amazon-devices/scope-based path withinnode_modulesfolder instead.

Vega CPU Profiler samples your app's performance every 5-15 ms during the recording session. The profiler performs the following tasks:
- Attaches to your app during recording.
- Analyzes performance data.
- Creates two files:
- A JSON file with hot functions summary
- A CPU profiler (traceEventsFilePath) that contains trace events in Trace Event Format for Chrome DevTools
Profiling helps you:
- Identify the most CPU-intensive areas of your codebase
- Prioritize which functions need optimization
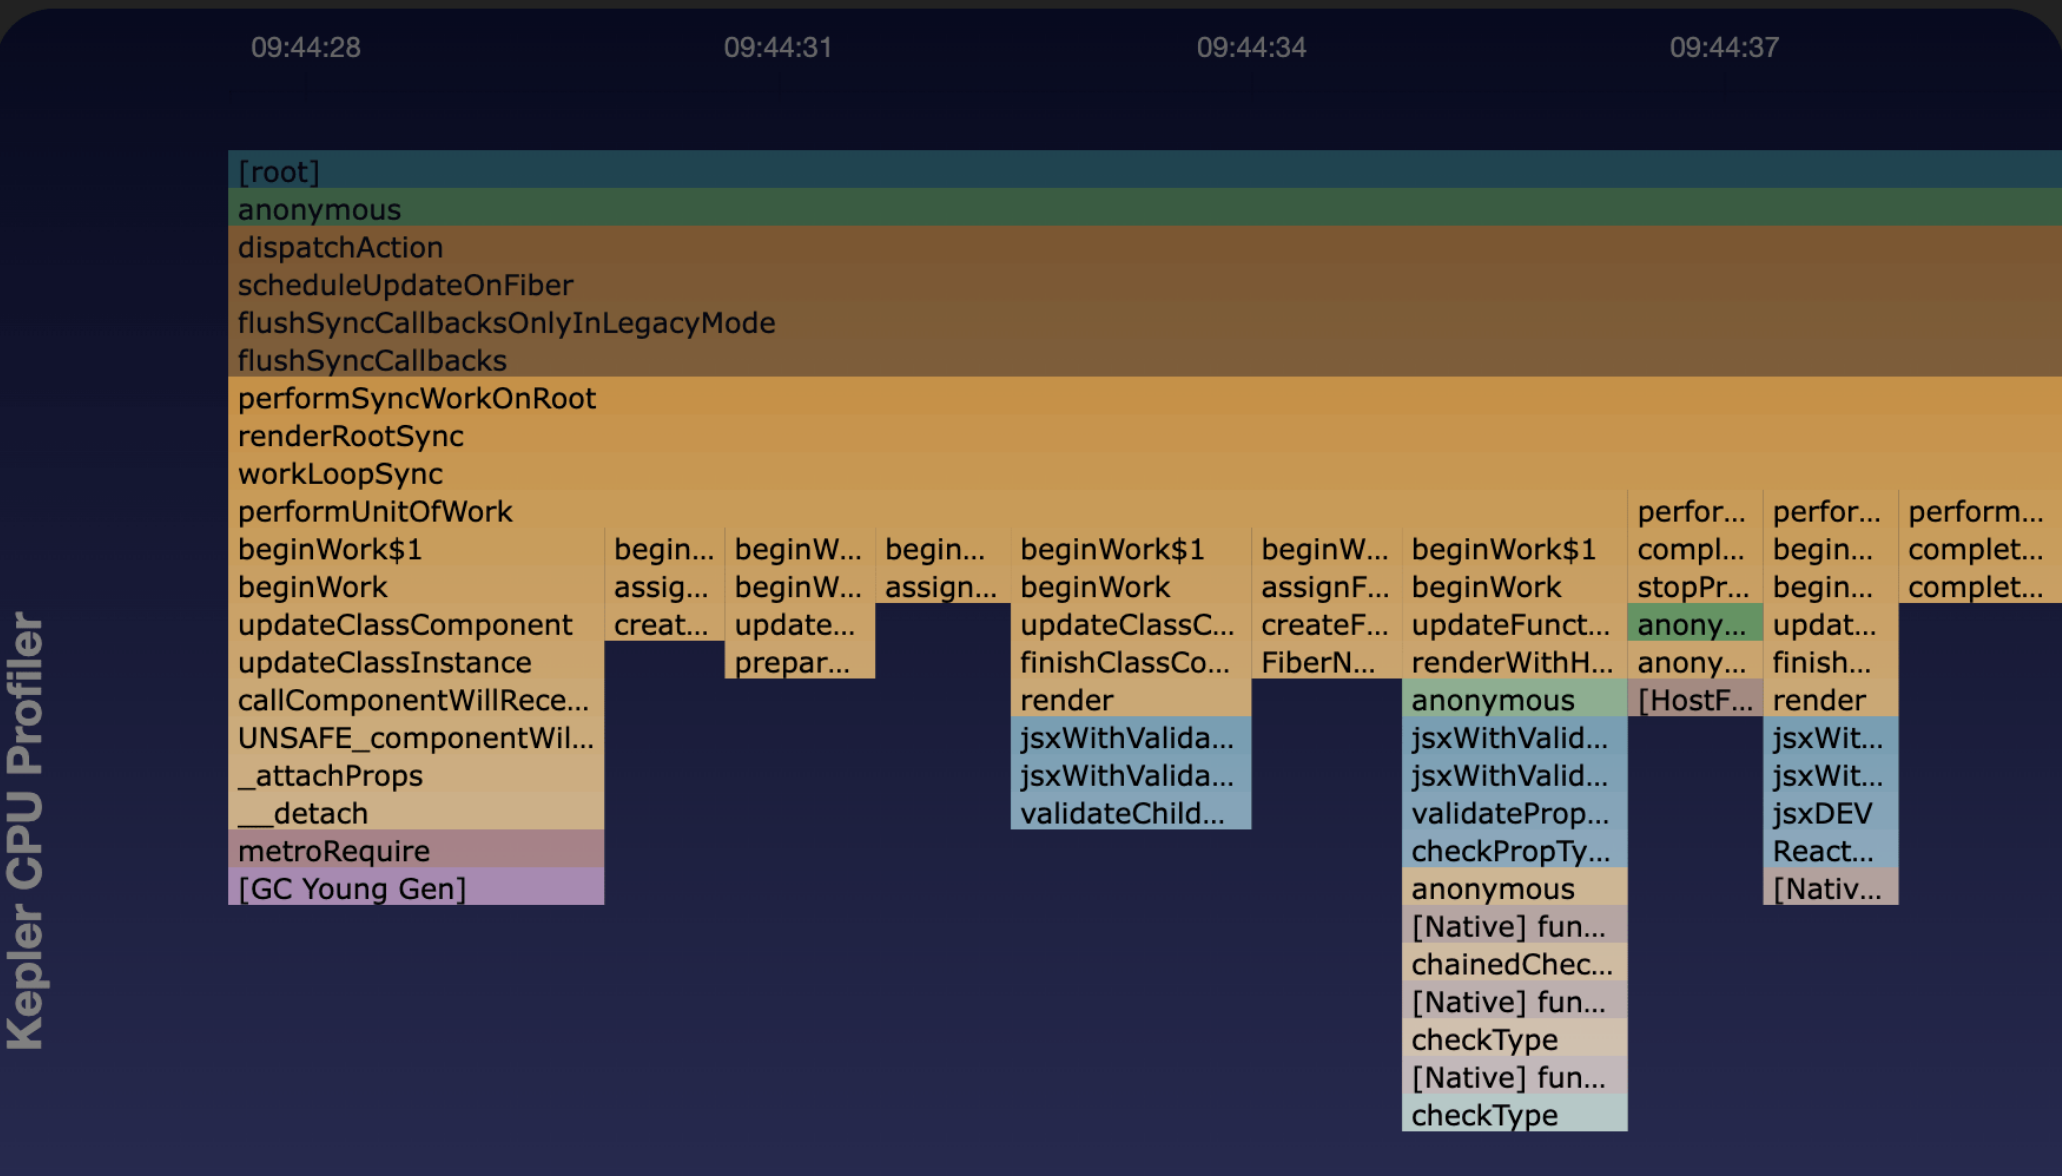
View hot functions and flamegraphs
Open the recorded file in Recording.
The following image shows a sample CPU profile recording:
Use Vega CPU Profiler at the performance command-line interface (CLI)
Provide --record-cpu-profiling and --source-map-file-path arguments to either the Activity Monitor or Record commands before starting a recording session.
Example:
vega exec perf activity-monitor
            --record-cpu-profiling
            --app-name=com.amazondeveloper.keplervideoapp
            --sourcemap-file-path=<JS Source Map File Path in kepler-build directory>
The contents of the JSON file includes CPU and memory utilization, and the process state.
Example:
{
   "traceRecords": [
      {
         "startTs": 1687263185520361000,
         "endTs": 1687263201482227000,
         "traceName": "FOREGROUND",
         "pid": 2838,
         "timestamp": null,
         "processName": "com.amazondeveloper.keplervideoapp"
      },
      {
         "startTs": 1687263201482227000,
         "endTs": 1687263215311317000,
         "traceName": "BACKGROUND",
         "pid": 2838,
         "timestamp": null,
         "processName": "com.amazondeveloper.keplervideoapp"
      }
   ],
   "activityRecords": [
      {
         "timestamp": 1687263185024674256,
         "system": {
            "cpu": {
               "numCores": 4,
               "aggregated": {
                  "user": 147.6,
                  "sys": 114.8
               },
               "cores": []
            },
            "memory": {
               "total": 1807052.8,
               "free": 667648.0,
               "used": 502784.0,
               "available": 1252147.2
            }
         },
         "process": [
            {
               "pid": 2838,
               "name": "com.amazondeveloper.keplervideoapp",
               "cpuPercentage": 130.0,
               "memPercentage": 3.8,
               "memRES": 68456.0
            }
         ]
      }
   ],
   "cpuRecords": [{
        "hotFunctions": [{
                "function_name": "GradientOverlay",
                "file_path": "/VegaVideoApp/src/components/miniDetails/Preview.tsx",
                "line_number": 28,
                "column_number": 7,
                "begin_timestamp": 8407098854,
                "end_timestamp": 8408235415,
                "duration": 1136561,
                "percent_of_total": 16.08
            },
         ],
         "traceEventsFilePath": "/VegaVideoApp/generated/2024-01-10_09-52-13/trace1704909179877459917-converted.json"
   }]
}
The JSON file contains three sections:
traceRecords
traceRecords records lifetime stages, using the following attributes.
startTs(start timestamp)endTs(end timestamp)pid(process ID)processName(app name)
activityRecords
activityRecords tracks Activity Monitor data on the system and process.
- On the system:
- CPU usage (
sysanduser) with each value up tonumCorestimes 100 - Memory usage
- CPU usage (
- On the process:
cpuPercentage(up tonumCorestimes 100)memPercentage(memory percentage of up to 100%)memRes(total memory the app uses with shared memory)pidandapp name(processID and name)
cpuRecords
cpuRecords stores the hot functions from Vega CPU Profiler.

The app generates a JSON file after recording ends and displays its location.
Flamegraphs
Flamegraphs shows system activity and CPU consumption, helping you spot potential bottlenecks or code inefficiencies. Each function node's width shows its CPU consumption time, including time spent in called functions (inclusive time).
Inclusive time is the time spent running a function, including the time spent in all functions, called by this function.
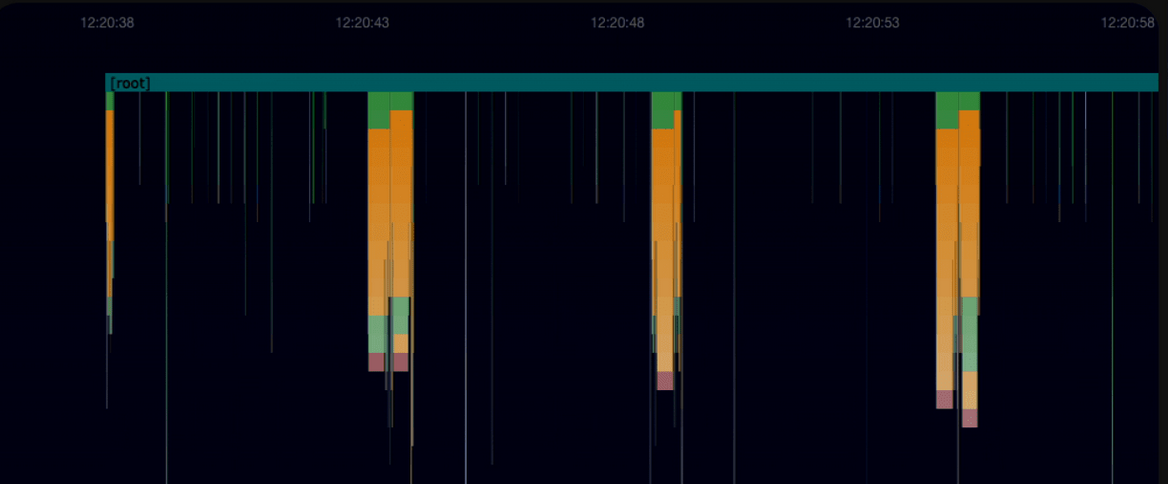
Flamegraphs show three key elements:
- Functions active during recording.
- Call stack order for each function
- Each function's approximate runtime.
Navigate through the flamegraph using the arrow keys or a-s-d-w keys on the keyboard.
By analyzing the flamegraph, you can pinpoint functions or code paths that might benefit from optimization. Wider nodes show more time spent, so you can prioritize your efforts effectively.
Color guide for function sources
Use the following color-code guide table to help you identify where the functions or code paths come from.
| Path | Code | Category |
|---|---|---|
| @amzn | #ff9900 | Amazon Orange |
| schedule | #008000 | Dark Green |
| Native | #a0522d | Brown |
| react | #087EA4 | React Blue |
| @react-native | #087EA4 | React Blue |
| root | #008080 | Teal |
| JavaScript | #4CAF50 | Light Green (your own code) |
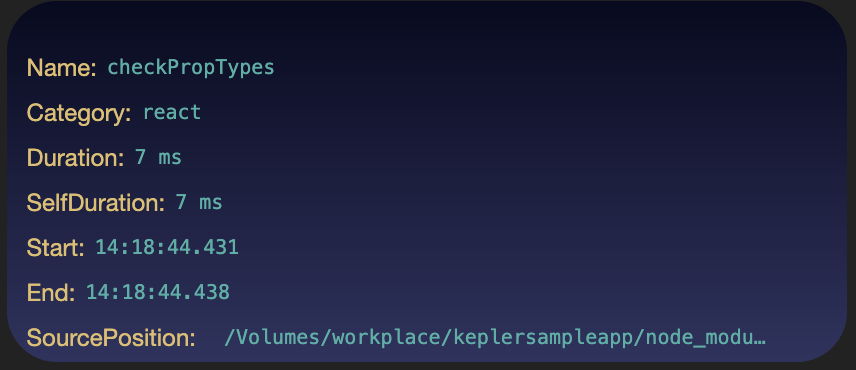
If you hover over the function nodes, the flamegraph displays the attributes of the function:
-
Name - The function name.
-
Category - The category to which the function belongs.
-
Duration - The approximate time (in ms) an app spent executing this function and all other child functions that it calls.
-
SelfDuration - The approximate time (in ms) an app spent executing this function excluding the time spend in child functions.
-
Start - The start timestamp of the function.
-
End - The end timestamp of the function.
-
SourcePosition - The source position with function name, line number, and column number.
Click SourcePosition to view function source code within your project.
Call Tree
Call Tree shows a hierarchy of function calls during profiling, listing the most time-consuming functions at the top.
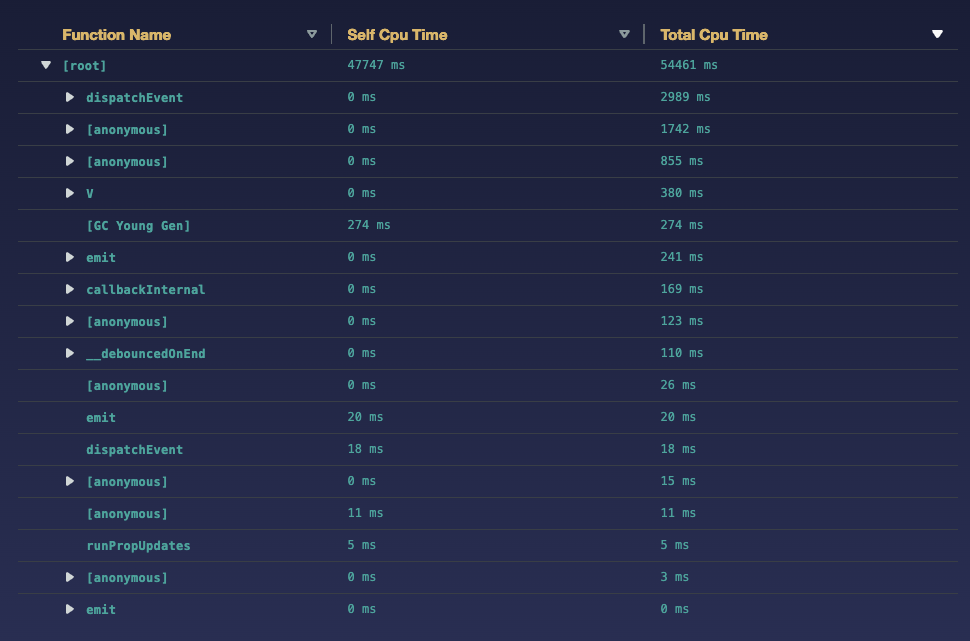
The grid shows:
Function Name - Function name and source position. Click the link to view the source code.
Total CPU Time - Total time, inclusive in milliseconds (ms), spent in each function, including the time spent in any child functions.
Self CPU Time - Total time, exclusive in milliseconds (ms), spent in each function, excluding the time spent in any child functions.
With Call Tree, you can perform the following tasks:
- Expand and collapse the nodes to focus on specific areas.
- Sort by Self CPU Time or Total CPU Time.
Open a previous recording
Use one of the following methods.
Option 1 (Preferred): Use Quick Open
This method provides access to your recordings through VS Code's interface or CLI.
From VS Code
- Find the recording file (example:
Basic-trace-recorder[timestamp].json) from the activity monitor using VS Code Quick Open or in the project'sgenerateddirectory. - Click the file once to preview or twice to open in active mode.
From CLI
-
Open a terminal window and enter:
code <<path-to-recording-file>> -
Open the command palette in VS Code.
Mac: Shift+Command ⌘+P
Linux: Ctrl+Shift+P
If your terminal doesn't recognize the code command:
- Open VS Code.
-
Open the command palette:
Mac: Shift+Command ⌘+P
Linux: Ctrl+Shift+P
- Run "Shell Command: Install code command in PATH".
- Retry the command.
Option 2: Use VS Code command palette
This method provides access to your recording using VS Code's built-in command interface or if Quick Open isn't available.
- Open VS Code.
-
Open the command palette:
Mac: Shift+Command ⌘+P
Linux: Ctrl+Shift+P
- Enter Vega: Open Recording View.
-
From the list, choose a previous recording session.
The session’s Recording View opens in a new window. If you have a current session in another tab, the focus is on the new session.
Related topics
- 💬 Community: Inspect JS traces from Vega Apps
- 💬 Community: How to merge JS profiler traces into a Perfetto trace file
- Measure App KPIs
- Identify UI Rendering Issues
- Investigate Component Re-rendering Issues
Last updated: Nov 14, 2025