
Profiling
Use the built-in profiler to get detailed information about work done in the JavaScript thread and main thread side-by-side. Access it by selecting Perf Monitor from the Debug menu.
Another way to profile JavaScript is to use the Chrome profiler while debugging. This won't give you accurate results as the code is running in Chrome but will give you a general idea of where bottlenecks might be. Run the profiler under Chrome's Performance tab. A flame graph will appear under User Timing. To view more details in tabular format, click at the Bottom Up tab below and then select DedicatedWorker Thread at the top left menu.
Profiling Vega UI Performance with systrace
The Vega Platform also provides robust profiling through its Vega Studio CLI. Its documentation covers how to collect and analyze traces for your app.
1. Collecting a trace
First, connect a device that exhibits the stuttering you want to investigate to your computer via USB and get it to the point right before the navigation/animation you want to profile. Run systrace as follows:
$ <path_to_android_sdk>/platform-tools/systrace/systrace.py --time=10 -o trace.html sched gfx view -a <your_package_name>
A quick breakdown of this command:
timeis the length of time the trace will be collected in secondssched,gfx, andvieware the android SDK tags (collections of markers) we care about:schedgives you information about what's running on each core of your phone,gfxgives you graphics info such as frame boundaries, andviewgives you information about measure, layout, and draw passes-a <your_package_name>enables app-specific markers, specifically the ones built into the React Native framework.your_package_namecan be found in theAndroidManifest.xmlof your app and looks likecom.example.app
Once the trace starts collecting, perform the animation or interaction you care about. At the end of the trace, systrace gives you a link to the trace which you can open in your browser.
2. Reading the trace
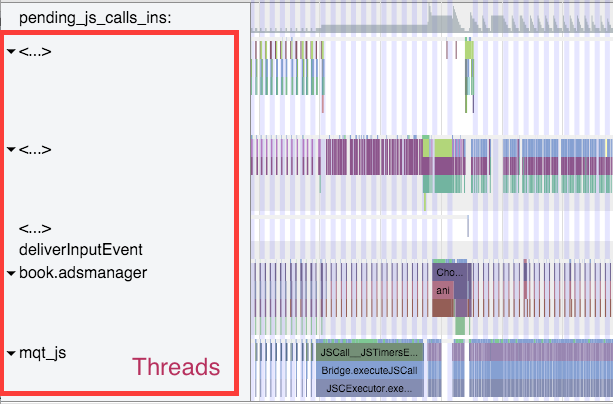
After opening the trace in your browser (preferably Chrome), you should see the trace of methods being called on threads:
:::note Hint Use the WASD keys to strafe and zoom. :::
If your trace .html file isn't opening correctly, check your browser console for an ObjectObserveError.
Since Object.observe was deprecated in recent browsers, you may have to open the file from the Google Chrome Tracing tool. You can do so by:
- Opening tab in chrome chrome://tracing
- Selecting load
- Selecting the html file generated from the previous command.
:::info Enable VSync highlighting Check this checkbox at the top right of the screen to highlight the 16ms frame boundaries:
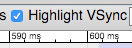
If what you see doesn't match the screenshot, try profiling on a different device: Samsung is known to have issues displaying vsyncs while the Nexus series is generally pretty reliable. :::
3. Find your process
Scroll until you see (part of) the name of your package. In this case, I was profiling com.facebook.adsmanager, which shows up as book.adsmanager because of silly thread name limits in the kernel.
On the left side, you'll see a set of threads which correspond to the timeline rows on the right. There are a few threads we care about for our purposes: the UI thread (which has your package name or the name UI Thread), mqt_js, and mqt_native_modules. If you're running on Android 5+, we also care about the Render Thread.
-
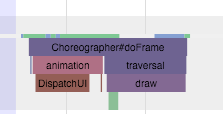
UI Thread. This is where standard android measure/layout/draw happens. The thread name on the right will be your package name (in my case book.adsmanager) or UI Thread. The events that you see on this thread should look like the following screenshot that contains
Choreographer,traversals, andDispatchUI:
-
JS Thread. This is where JavaScript is executed. The thread name is either
mqt_jsor<...>depending on how cooperative the kernel on your device is being. If the thread doesn't have a name, look for things likeJSCall,Bridge.executeJSCall, etc: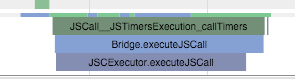
-
Native Modules Thread. This is where native module calls (for example, the
UIManager) are executed. The thread name is eithermqt_native_modulesor<...>. To identify the thread, look for things likeNativeCall,callJavaModuleMethod, andonBatchComplete: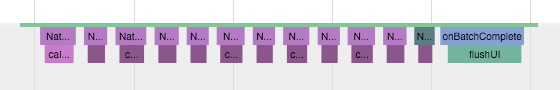
-
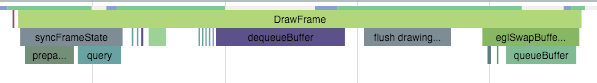
Bonus: Render Thread. If you're using Android L (5.0) and up, you will also have a render thread in your application. This thread generates the actual OpenGL commands used to draw your UI. The thread name will be either
RenderThreador<...>. To identify it in the latter case, look for things likeDrawFrameandqueueBuffer:


Identifying a culprit
A smooth animation should similar to this screenshot:
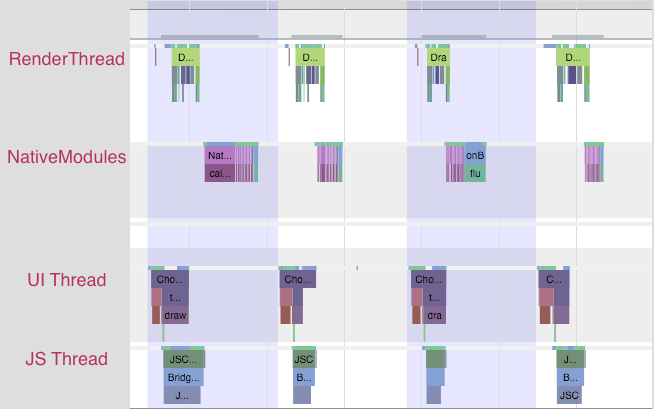
Each change in color is a frame – remember that in order to display a frame, all our UI work needs to be done by the end of that 16ms period. Notice that no thread is working close to the frame boundary. An application rendering like this is rendering at 60 FPS.
If you noticed chop, however, you might see something similar to this screenshot:
Notice that the JS thread is executing almost all the time, and across frame boundaries! This app is not rendering at 60 FPS. In this case, the problem lies in JS.
You might also see something similar to this screenshot:

In this case, the UI and render threads are the ones that have work crossing frame boundaries. The UI that we're trying to render on each frame is requiring too much work to be done. In this case, the problem lies in the native views being rendered.
At this point, you have some very helpful information to inform your next steps.
Resolving JavaScript issues
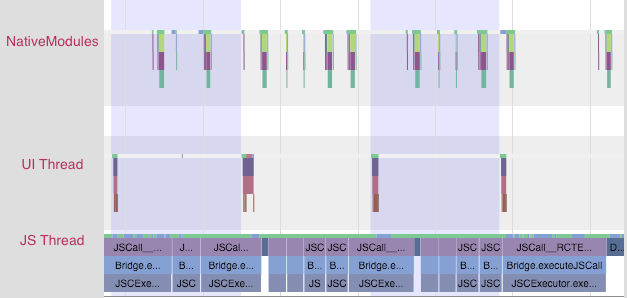
If you identified a JS problem, look for clues in the specific JS that you're executing. In the scenario above, we see RCTEventEmitter being called multiple times per frame. Here's a zoom-in of the JS thread from the previous trace:
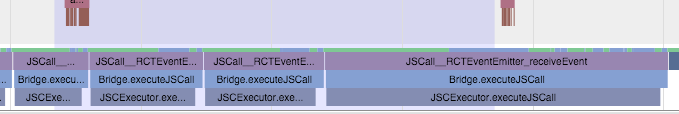
This trace pattern doesn't seem right. Why is the method being called so often? Are they actually different events? The answers to these questions depend on your product code. And many times, you might want to look into shouldComponentUpdate.
Resolving native UI issues
If you identified a native UI problem, there are usually two scenarios:
- the UI you're trying to draw each frame involves too much work on the GPU, or
- You're constructing new UI during the animation/interaction (e.g. loading in new content during a scroll).
Too much GPU work
In the first scenario is a trace that has the UI thread and/or Render Thread looking like this screenshot:
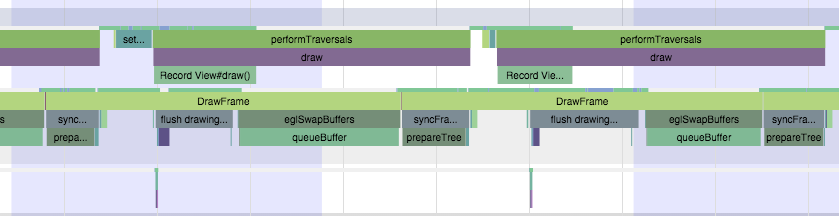
Notice the long amount of time spent in DrawFrame that crosses frame boundaries. This is time spent waiting for the GPU to drain its command buffer from the previous frame.
To mitigate this, you should:
- investigate using
renderToHardwareTextureAndroidfor complex, static content that is being animated/transformed (for example, theNavigatorslide/alpha animations) - make sure that you are not using
needsOffscreenAlphaCompositing, which is disabled by default, as it greatly increases the per-frame load on the GPU in most cases.
Creating new views on the UI thread
In the second scenario, you see something like this screenshot:
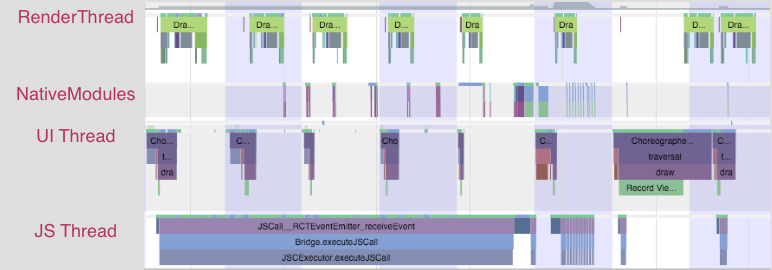
Notice that first the JS thread thinks for a bit, then you see some work done on the native modules thread, followed by an expensive traversal on the UI thread.
There isn't a quick way to mitigate this unless you're able to postpone creating new UI until after the interaction, or you are able to simplify the UI you're creating. The react native team is working on an infrastructure level solution for this that will allow new UI to be created and configured off the main thread, allowing the interaction to continue smoothly.
Last updated: Dec 10, 2025