Alexa Blogs
As a skill developer, you want to make sure that your skill is always working as expected and providing a consistent experience to your customers. One way to do this is with continuous monitoring so that you’re alerted about unexpected errors that may arise with your skill. Monitoring enables you to identify the root-cause of any errors and address those issues quickly. If you do not have monitoring in place, skill issues and errors may go unnoticed for an extended period of time, which could lead to a poor skill experience.
If you have a custom skill that uses AWS Lambda as the back end, follow the steps below to create alerts using Amazon CloudWatch alarms to get notified when there is a spike in errors for your skill.
Logging Error Information
In order to monitor skills for errors, you first need to log the appropriate errors. In case of errors with a skill request, the skill receives a SessionEndedRequest that contains the error message and error type. You can log this error information to identify the cause of errors with their skill. For complete instructions on how to log and debug this error information, refer to this blog post. For this example, every time I get a SessionEndedRequest due to a skill error, I will log it with the prefix “Error Message.”
Adding a Metric Filter in CloudWatch
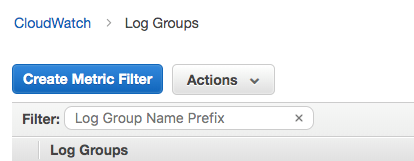
Once you have the error information being logged, the next step is setting a metric filter that you can use to track your errors from CloudWatch. First, you will go to https://console.aws.amazon.com/cloudwatch. Next, in the navigation panel on the left, select Logs. Then, identify the log group for your skill and click on Create Metric Filter.

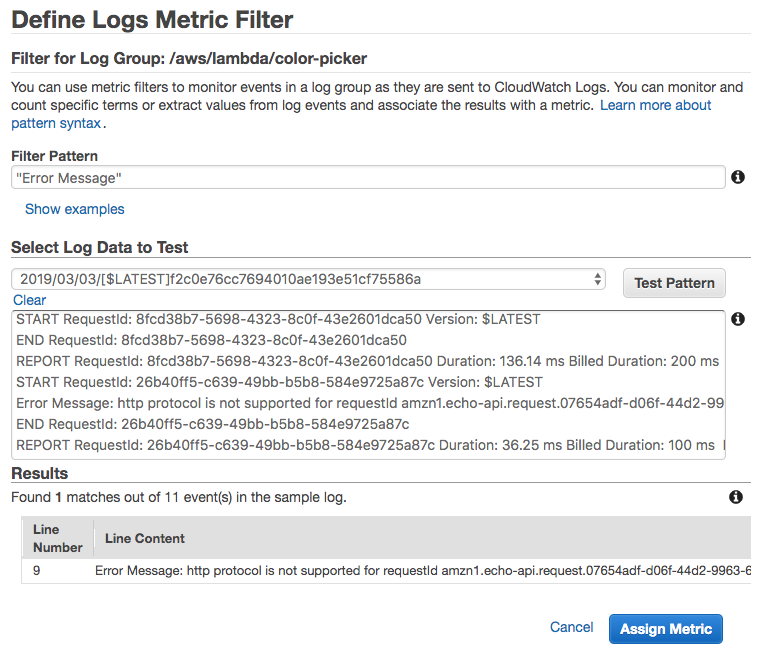
This will open the Define Logs Metric Filter screen. In the filter pattern, enter “Error Message” (or the prefix from your logs on which you want to be alerted on). You will also have an option of testing whether your pattern works.

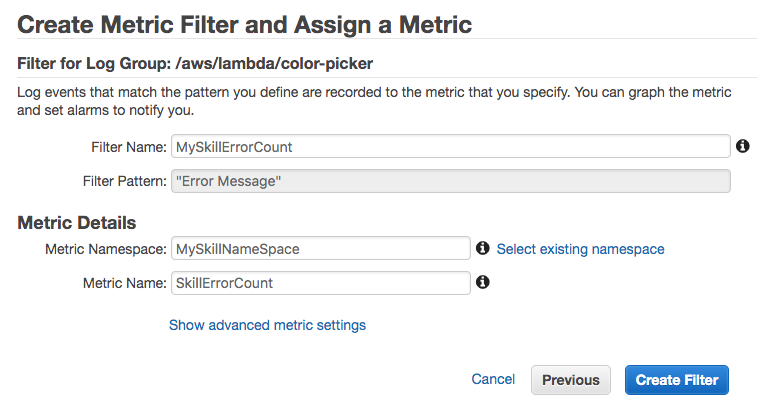
Next, click on assign metric. This will open the Create Metric Filter and Assign a Metric screen. Enter the Filter Name, Metric Namespace, and Metric Name and then click Create Filter.

Note: You can also setup your metrics based on individual error types so that you can have separate alarms; for example, for error types INVALID_RESPONSE and INTERNAL_SERVICE_ERROR. You can control this by logging the particular error type in your logs and building your metrics based on each pattern. You can find a list of error types for a custom skill here.
Creating the Alarm
Once you have your Metric Filter created, you are ready to create alarms. You want to be notified in case you see a rise in errors (identified by your metric filter). Click on Create Alarm for your metric filter.
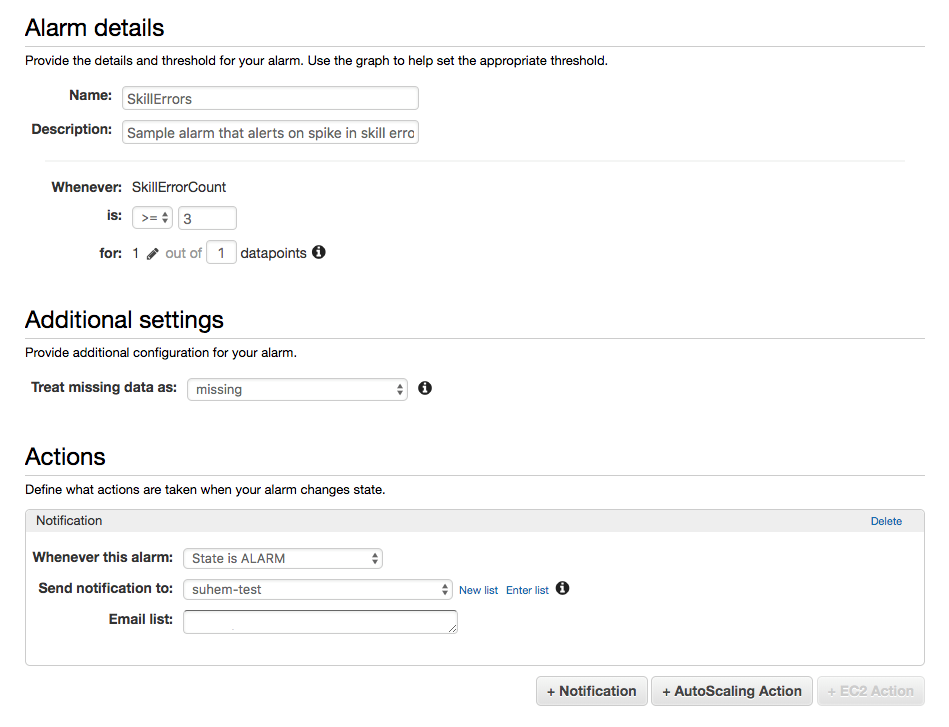
 On the create new alarm screen, provide a name and description for your alarm. Also, provide the threshold for the number of errors for which you want to be alerted on. For this example, I will set it as greater than or equal to 3. Next, in the Action section, you can select the method of notification when this alarm is triggered. For my example, I have created an AWS SNS topic and subscribed my email to it. So, when this alarm is triggered, it will send me an email on the provided email address.

Now, whenever customers invoke my skill and there is a spike in errors (three or more requests with errors in this example) on the skill’s back end (and customers hear “Sorry I’m having trouble accessing your skill right now”), I will receive an email notification informing me about the error with the skill. See the example email below:

I can then debug and identify the root cause of the issue and resolve it before a lot of customers are impacted by this error.
Related Content
For more information on debugging and troubleshooting custom skills, check out these resources:
