Using AWS X-Ray to debug, monitor and scale your Alexa custom skill

For the third post of our series "Getting started with Alexa”, Mav Peri, a Senior Solutions Architect for Alexa guides you through how to debug, monitor, and scale your Alexa Custom Skill serverless backend using AWS X-Ray.
Mav is a senior solutions architect for Amazon Alexa and a disability advocate who is also a single parent of two amazing boys. Prior to joining the Alexa team, he spent four years as a Senior Solution Architect at AWS.
Custom Alexa Skills are a great way to engage Alexa customers, and provide them with unique experiences. To ensure that your skill functions properly, you need to make sure that the back end is debugged, monitored, and scaled correctly. In this blog post, we will discuss how to use AWS X-Ray to achieve these goals.
First, we will discuss briefly AWS X-Ray is and how it can help you monitor your custom skill backend. Then we will dive into the steps you need to take to enable X-Ray tracing and standardize your naming conventions for annotations and metadata keys. Finally, we will talk about how to use the information gathered from AWS X-Ray to debug and optimize your custom skill backend.
What is AWS X-Ray?
AWS X-Ray is a tool that enables developers to trace and analyze distributed applications. With AWS X-Ray, developers receive complete visibility into how requests are flowing and behaving across the components of an application. This includes APIs, microservices, and other distributed components, making it easier to identify and solve issues that impact application performance.
Custom skills and other serverless microservices are often composed of Lambda functions, APIs, and other cloud services. AWS X-Ray provides an in-depth view of how these different services are interacting with each other and can pinpoint performance issues in these services. This gives developers a better insight into the behavior of custom skill applications, allowing them to identify and resolve issues that could impact performance or the customer experience.
One of the biggest advantages of AWS X-Ray is that it enables developers to identify specific issues in their applications. This provides answers to some crucial questions like where a delay is occurring in a particular process, or which component is getting overwhelmed. With AWS X-Ray, custom skill builders have the ability to find and fix these issues more quickly. This means that applications can be developed more efficiently, and with optimized performance.
If you are a custom skill builder, AWS X-Ray can help identify and resolve application performance issues, making it a vital tool in your toolkit. The tool provides developers with complete visibility of an application, allowing a bird’s eye view of how requests are flowing and behaving across application components. With AWS X-Ray, custom skill builders can stay on top of their application, improving performance for the end-user.
Please note that AWS X-Ray tracing is not available in Alexa hosted skills. If you want to use AWS X-Ray, you must host the skill Lambda function in your own AWS account.
Implementing AWS X-Ray to a custom skill Lambda
The example in this post is based on nodejs runtime.
Enable tracing in the Lambda function of our custom skill.
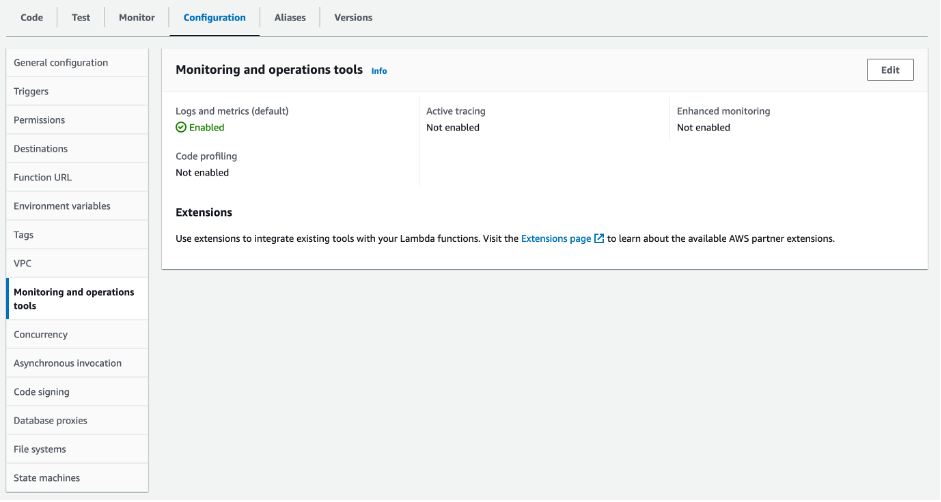
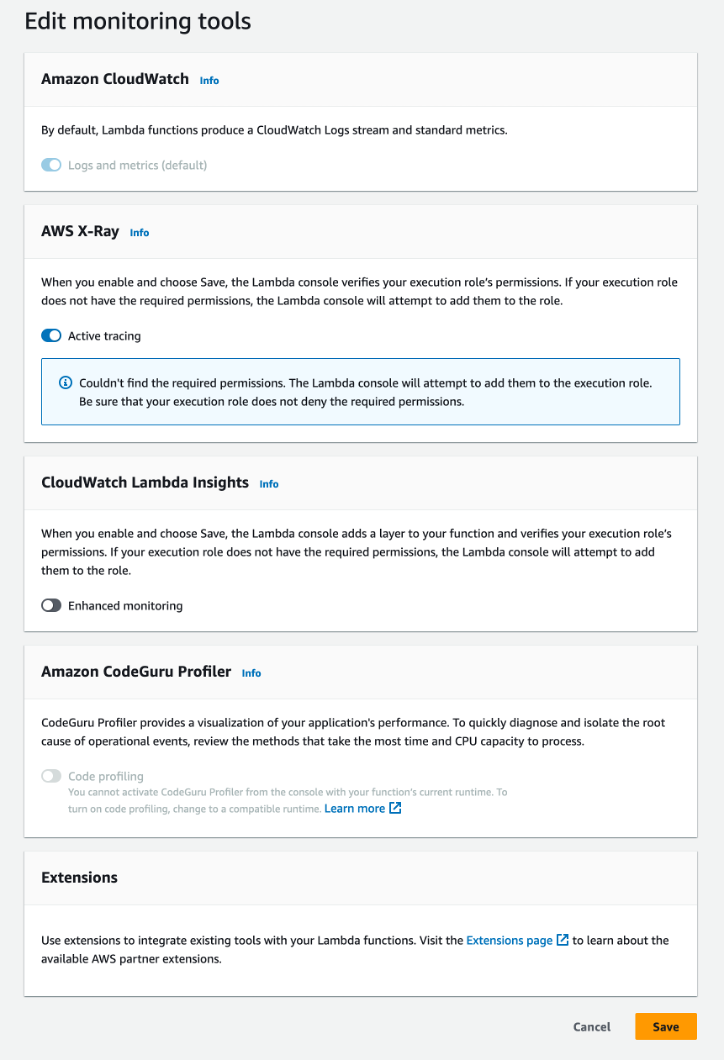
To begin, ENABLE X-RAY tracing for the function through the AWS Console.
Go to the Lambda monitoring and operation tools section, and click the edit button on the top right.
Select the AWS X-Ray switch and hit save.
Time to instrument the code
The next step is to instrument our fubction code. By enabling X-Ray tracing in your function, you will be able to use AWS X-Ray to trace the requests made to your Alexa custom skill backend.
1) To do this, you will need to import the AWS X-Ray core SDK into your function using the following code:
//at the top of each file you want to trace
const AWSXRay = require('aws-xray-sdk-core');
AWSXRay.enableManualMode();
Then, you will need to enable tracing for the function using the following code:
// this will capture calls to AWS services like DynamoDB.
AWSXRay.captureAWS(require('aws-sdk'));
2) Implement subsegments to handlers and downstream functions.
Once you have enabled tracing, you will need to instrument your handlers and downstream functions with subsegments. Subsegments are smaller parts of the trace that represent a specific action within the trace. To do this, you will need to use the following code:
// create a new subsegment within the current trace called LaunchRequestHandler
const mySubSegment = AWSXRay.getSegment().addNewSubsegment('segment name eg launchHandler');

// Your code here
mySubSegment.close();
This will create a subsegment within the trace and enable you to monitor the performance of specific sections of your code.
3) Capture annotations and metadata for debugging and optimization.
Now that you have subsegments in place, you can begin to capture annotations and metadata for debugging and optimization. Annotations are key/value pairs that provide additional context to the trace, while metadata is information that is attached to the trace but does not show up in the trace visualization. To capture annotations and metadata, you will need to use the following code for a 'hello world' launchHandler:
// add an annotation called 'handler' with value 'launchHandler'
mySubSegment('handler', 'launchHandler');

// add annotation with key of requestType and value 'LaunchRequest'
 mySubSegment.addAnnotation('requestType', Alexa.getRequestType(handlerInput.requestEnvelope) );

// add an annotation with key speakOutput
// and value 'Welcome, you can say Hello or Help. Which would you like to try?'
mySubSegment.addMetadata('speakOutput', speakOutput);
To mark error messages as faults with the .addFaultFlag(), you can use a try/catch block.
try {
// code to try
 } catch (error) {
           const speakOutput = 'Sorry something went wrong, please try again later.';
           // add an annotation called 'error' with the error message'
           mySubSegment.addAnnotation('error', JSON.stringify(error.message));
           // add an annotation called speakOutput which has the value of the const speakOutput.
           mySubSegment.addMetadata('speakOutput', speakOutput);
           //add fault flag
           mySubSegment.addFaultFlag();
           let handlerResponse = handlerInput.responseBuilder
               .speak(speakOutput)
               .getResponse();
           // end the subsegment
           mySubSegment.close();
           return handlerResponse;
       }
It's important to remember that JSON objects cannot be used as values for annotations or metadata. To use JSON in this case, we need to convert it to a string using JSON.stringify().
The instrumented launch handler:

4) Searching for traces to investigate performance and when to use annotations Vs metadata.
Annotations can be searched for using the AWS X-Ray console (part of CloudWatch), but metadata can only be viewed on the trace detail screen of the console. For our example, you can search for traces that include the handler name launchHandler or errors using annotations.
In the example screenshot bellow, we can see all traces completed recently in a test skill that include the annotation key ‘handler’ (select from the refine query by dropdown).
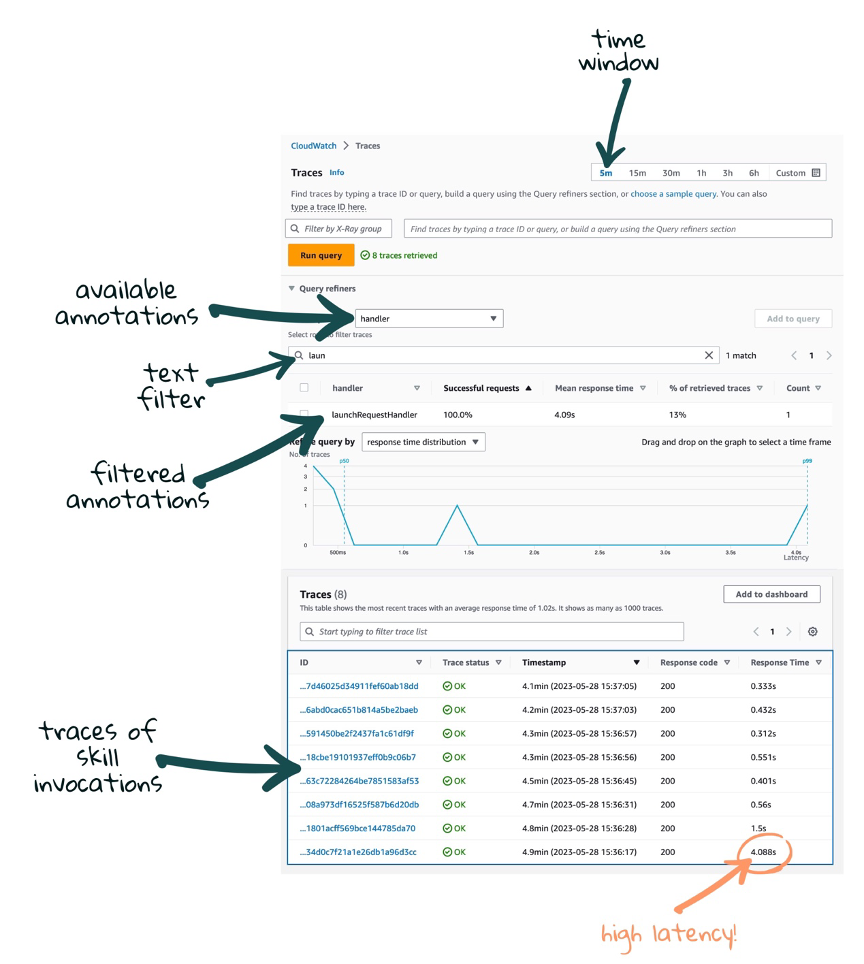
When you type the first few letters of the word launchHandler, the available handlers are filtered down to just the one we are looking for. Select the handler and hit the Add to query button.

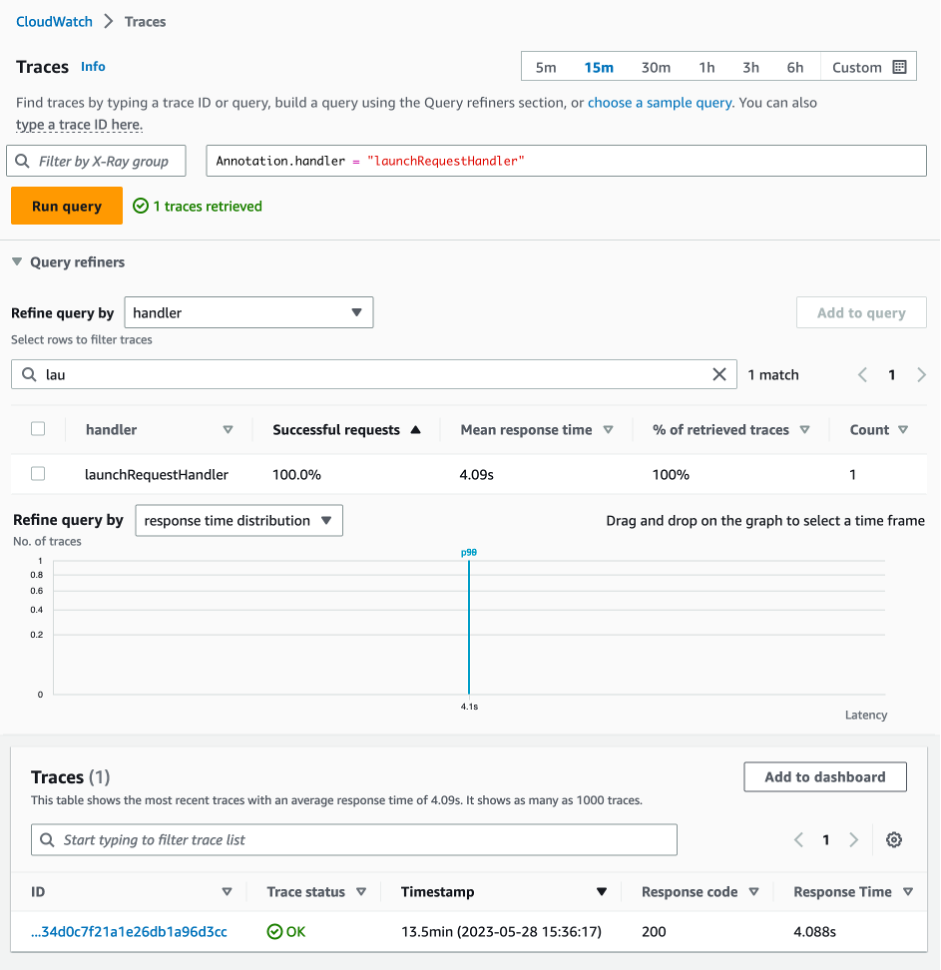
Our query at the top now contains a search for the handler we are interested in investigating.

Hit the Run query button and now the console only shows the traces for the launchHandler
4) Standardize the naming convention of your annotations and metadata keys.
We recommended to use a consistent naming convention for your annotations and metadata keys to improve the clarity of the trace and maintain data consistency. For instance, you can utilize "handler" for annotations pertaining to request handlers and "error" for metadata associated with error messages.
Identifying a slow response
To identify slow responses, we look at the response time of the traces listed. In the example screenshot below you can see that there are some skill invocations above 3 seconds. We can click on the trace ID to understand where the time was spent.
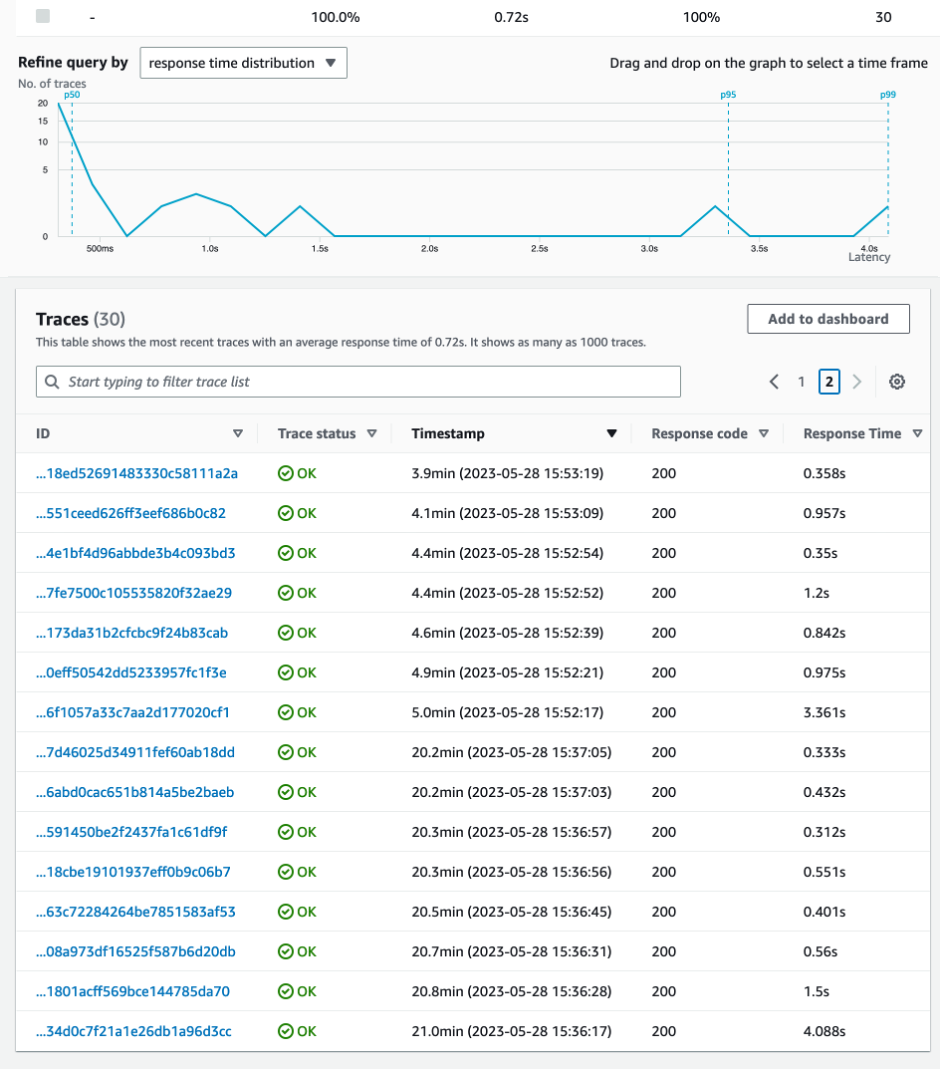
Looking at the trace detail
It’s now time to look at the trace detail to see what our skill did during the invocation and where the time was spent!

Conclusion
Using AWS X-Ray to monitor and debug your custom skill backend is a great way to improve the developer experience and the end-user experience. By enabling X-Ray tracing, implementing subsegments, capturing annotations and metadata, and standardizing naming conventions, you can gain a deeper understanding of how your skill is performing in real-time and identify bottlenecks and errors. This will allow you to improve the skill experience for users while also ensuring that the code is optimized and runs smoothly.


