
使用Vega Studio调试网页应用
使用Vega Studio调试网页应用
开放Beta测试文档 作为预发布开放Beta测试的一项内容,亚马逊提供了此技术文档。随着亚马逊收到反馈并对功能进行迭代,所描述的这些功能可能会发生变化。有关最新功能的信息,请参阅最新的发布说明。
Vega Studio是Vega应用的集成开发环境 (IDE)。它与Chrome DevTools (CDT) 集成,可以连接和调试WebView应用。使用CDT,您可以检查渲染的HTML内容并通过设置断点来调试JavaScript,就像普通网页应用一样。
使用以下指南用Vega Studio设置CDT调试会话。
先决条件
- 安装Visual Studio Code。
- 安装Vega Studio扩展(0.21版或更高版本)
调试Vega网页应用的步骤
- 使用Vega Studio打开您的应用。
- 构建并启动一个调试版本。
- 可以通过以下两种方式之一来启动您的应用。
- 从命令行启动。
-
点击Vega Studio边栏的“播放”按钮。
注意: 要使用Chrome DevTools进行调试,请使用调试配置构建目标应用。
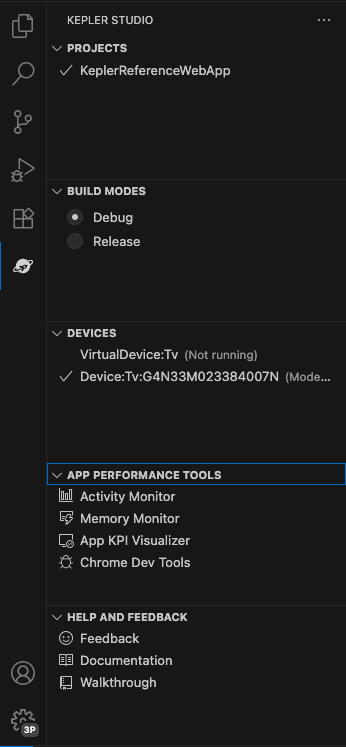
- 从VegaStudio启动Chrome DevTools
-
打开Vega Studio侧边栏并单击“Chrome DevTools”。
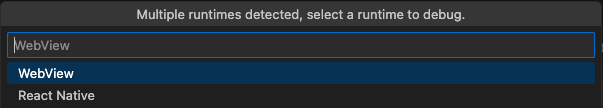
-
注意用于选择目标运行时的组合框。选择WebView以调试在WebView上运行的HTML + JavaScript内容
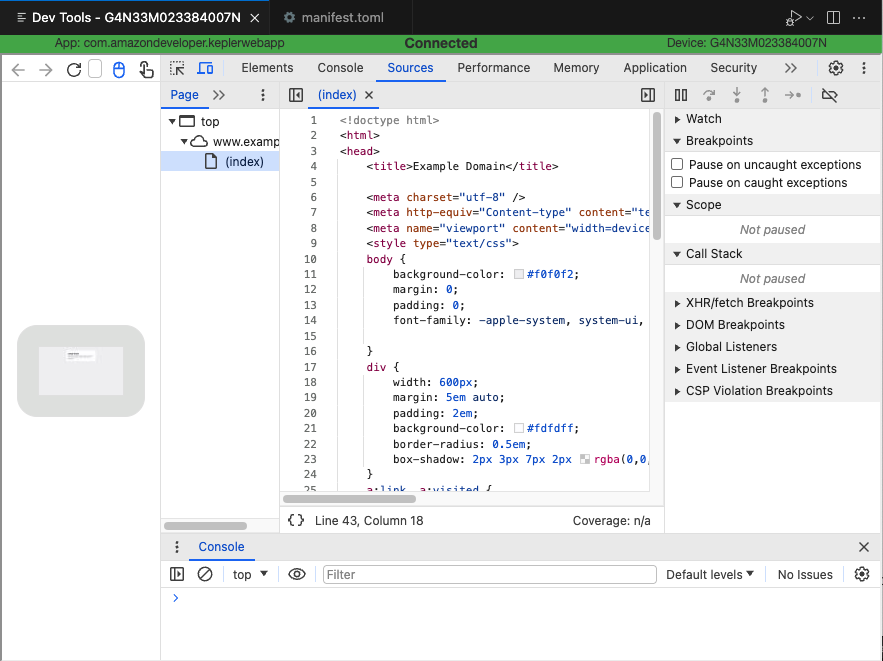
- Chrome DevTools出现在编辑器中并附加到WebView运行时。可以检查HTML和JavaScript源代码,也可在JavaScript源代码中设置断点。
相关主题
- 有关Chrome DevTools的详细信息,请参阅使用Chrome DevTools进行应用分析
- Vega网页应用概述
Last updated: 2026年2月19日