- A component inspector to examine hierarchy, props, and styles.
- A console for viewing JavaScript logs.
- A built-in profiler to analyze component re-rendering and its causes.
- Network, Performance, and Memory tabs for deeper analysis.
Prerequisites
- React Native 0.83 or later. React Native DevTools isn’t available on earlier versions. If your app uses RN 0.72, use Chrome DevTools instead.
- Two terminal windows: one for port forwarding and app launch commands, and one for the Metro bundler.
- A Vega app built in debug mode.
Set up React Native DevTools
Step 1: Set up port forwarding
In your first terminal, run:<<Device_Serial_Number>>.
The command runs without returning to the prompt, indicating the forwarding session is active. Leave this terminal open.
Step 2: Start Metro
In your second terminal, navigate to your project directory and start the Metro bundler:Step 3: Launch your debug app
After Metro is running, go back to your first terminal and launch the debug version of your app:BUNDLE index.js in the Metro terminal. This confirms the device is communicating with the bundler.
If Metro doesn’t show BUNDLE index.js, verify that port forwarding is active and that Metro was started before the app.
Step 4: Open React Native DevTools
In the Metro terminal, press j to open React Native DevTools. A browser window opens with the React Native DevTools interface.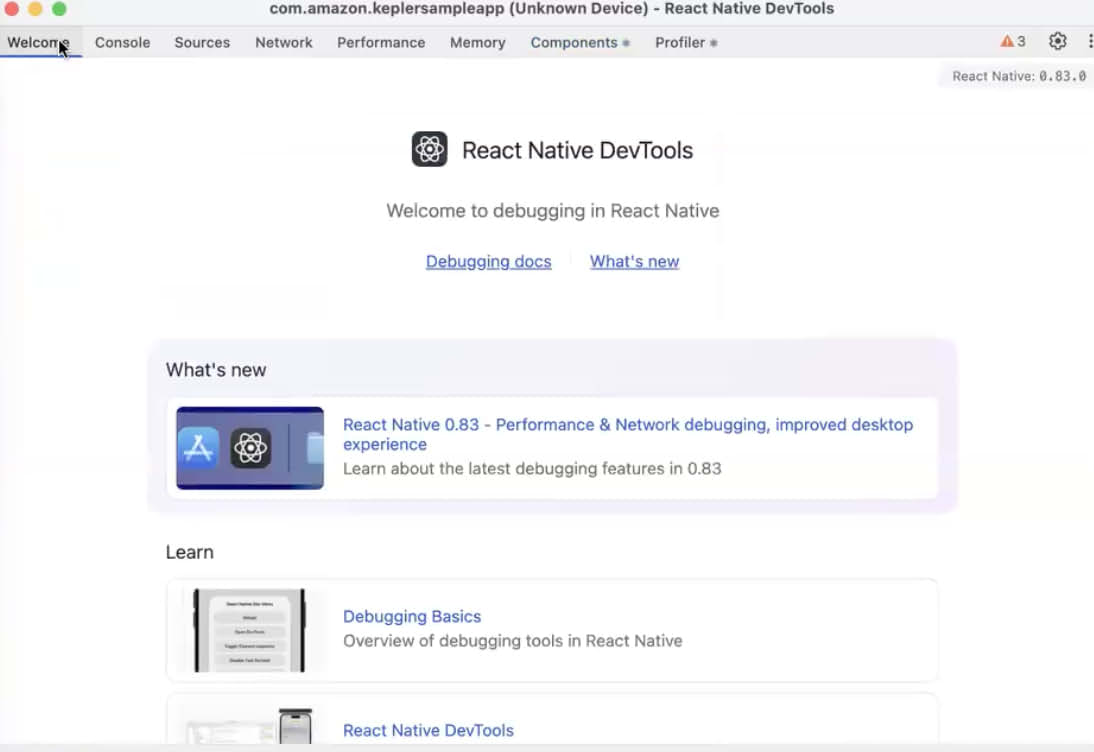 The title bar displays your app name and device information (for example, “com.amazon.keplersampleapp (Unknown Device) - React Native DevTools”).
If React Native DevTools doesn’t open, press r in the Metro terminal to reload the app and try again.
The title bar displays your app name and device information (for example, “com.amazon.keplersampleapp (Unknown Device) - React Native DevTools”).
If React Native DevTools doesn’t open, press r in the Metro terminal to reload the app and try again.
Inspect and debug your app
React Native DevTools includes the following tabs: Welcome, Console, Sources, Network, Performance, Memory, Components, and Profiler. This page covers the Components, Profiler, Network, Performance, and Memory tabs.Components
Use the Components tab to examine your component hierarchy, props, and styles. The tree view shows the full structure of your React component tree, from the RootComponent down to individual Text and View elements.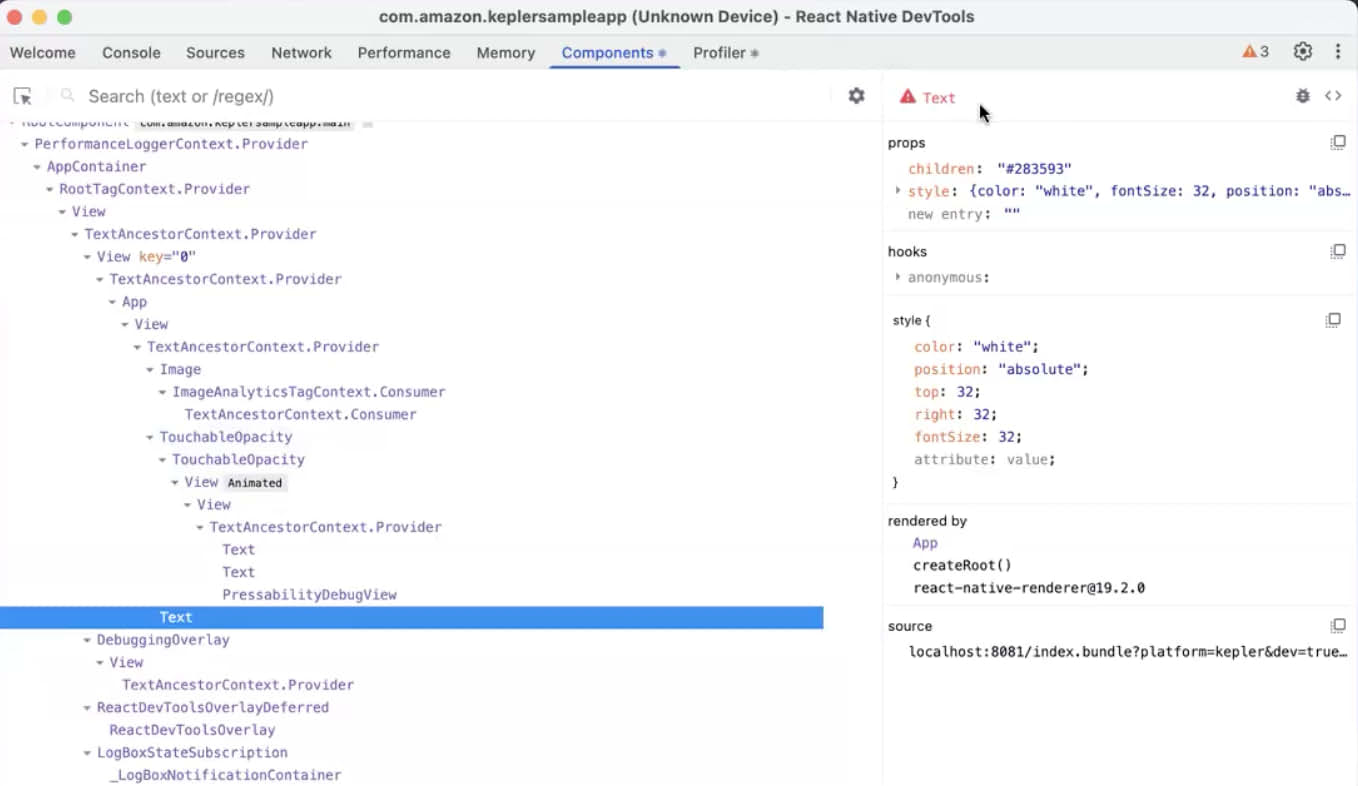
Profiler
The Profiler tab helps you measure rendering performance by recording commit cycles as you interact with your app.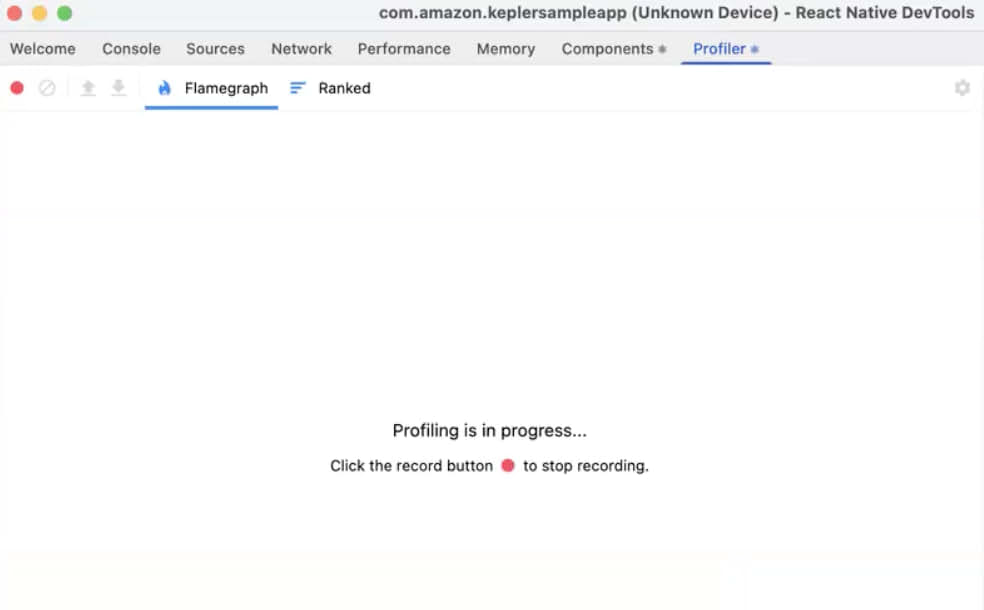
Step 1: Start profiling
Select the Profiler tab then the record button (blue circle) in the toolbar. The screen displays “Profiling is in progress…” while it captures render data.Step 2: Interact with your app
While profiling is active, navigate through your app to capture the rendering behavior you want to analyze. Each user interaction that triggers a React render is recorded as a commit.Step 3: Stop profiling
Select the red record button to stop recording. The Profiler displays the captured commits as a bar chart in the timeline. Each bar represents a React commit cycle. Taller, yellow bars indicate longer renders. Select a bar to inspect the components rendered in that commit.Step 4: Analyze results
The Profiler provides two views to analyze the recorded data: Flamegraph view The Flamegraph shows the component tree for a selected commit. Each bar represents a component. The bar width indicates how long it took to render. The right panel shows commit details:- Priority – the render priority (Normal or Sync).
- Committed at – when the commit occurred relative to the profiling start.
- Durations – Render time, Layout effects, and Passive effects.
- What caused this update? – the component that triggered the re-render.
Network
The Network tab captures HTTP and HTTPS traffic, includingfetch calls, XHR requests, and media segments. Use it to inspect requests, responses, headers, and timing, and to trace which line of your code fired each request.
Use the Network tab to:
- Check which API calls your app makes and whether they succeed or fail.
- Inspect the data your app receives from a server.
- Trace which code triggered a request.
- Measure request duration and spot slow connections.
200 OK status code, and check response headers for caching behavior, content type, and server information. You can also debug cross-origin resource sharing (CORS) issues by checking the Access-Control-Allow-Origin header.
Preview
Use the Preview tab to browse structured JSON responses in a collapsible tree view. This lets you verify the shape of the data your app receives without reading raw text, and spot unexpected null or missing fields at a glance.
Response
Use the Response tab to see the complete raw JSON payload with line numbers. Use this view to copy response data for debugging or comparison, and to verify the exact data format, field names, and values returned by the API.
Initiator
Use the Initiator tab to identify exactly which code triggered a network request. It shows the full call stack from the user interaction through the event handler to the network call, and you can select any entry in the stack to jump to the corresponding source location.
Timing
Use the Timing tab to measure the total duration of a request and break it down into phases, such as stalled or queued time versus content download time. A long stall time suggests connection setup overhead rather than server latency.
Request list and filters
The request list shows all requests in chronological order. Filter the list by type, such as Fetch/XHR, JS, Img, Media, or Other, and track the total data transferred. Scroll the timeline bar at the top of the tab to see requests outside the current window.
Override responses
To test how your app handles a modified response, open the context menu for a request, select Override headers, edit the value, and save the change. This works for both JSON and media requests.
Media traffic
For streaming apps, HTTP Live Streaming (HLS) video segments (.ts files) appear under the Media filter, and Dynamic Adaptive Streaming over HTTP (DASH) chunks (.m4s files) appear under the Other filter.
What the Network tab can and can’t do
The following table summarizes Network tab capabilities as verified on Vega.
Performance
The Performance tab records and visualizes your app’s activity over time. Use it to find dropped frames, understand how network requests, rendering, and JavaScript execution overlap, and see what’s blocking the main thread. Use the Performance tab to:- Record and visualize app activity over time to find dropped frames or slowness.
- See how network requests, rendering, and JavaScript execution overlap on a timeline.
- Identify what’s blocking the main thread or causing UI freezes.
- Understand the scheduling of React renders, transitions, and Suspense boundaries.
Memory
Use the Memory tab to capture a heap snapshot and see how much memory your app is using and which object types consume it. The snapshot shows retained memory grouped by constructor, such as Functions, Arrays, and CodeBlocks, so you can identify which object types hold the most memory. For advanced leak detection, see Detect Memory Leaks for guidance on using MemLab.Other tabs
React Native DevTools also includes the following tabs for additional debugging and analysis:- Console – view
console.log,console.warn, andconsole.erroroutput from your app. In React Native 0.83, logs no longer appear in the Metro terminal. - Sources – browse and debug your JavaScript source files with breakpoints, watch expressions, and call stack inspection.
Known limitations
- Component highlight and overlay errors – selecting a component to highlight it on-device can produce a repeating
TypeError: Cannot read property 'style' of nullfromreact-devtools-core. This doesn’t affect captured Profiler data. Commits, the Ranked view, and update attribution still render correctly. The on-device element highlight itself isn’t functional. Don’t treat this as an app bug. - Reload actions can crash the app – avoid reloading from within DevTools during a session.
- Network request control isn’t supported – block and replay actions register in the UI but don’t take effect, on Vega, Fire OS, and stock React Native alike. This is consistent with the React Native DevTools documentation, which lists network response mocking, WebSocket inspection, and throttling as unimplemented. Redirects, throttling, and live breakpoints aren’t available at all. Use Charles Proxy for these.
Connection issues
If DevTools loses connection to the device, a dialog displays “DevTools is disconnected” with the reason. Choose Reconnect DevTools to reconnect, or Dismiss to continue viewing the current data while disconnected.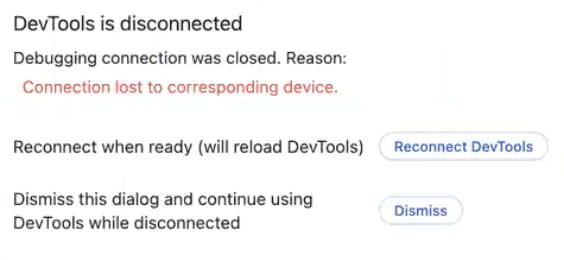 If you see “Connection refused” errors, confirm port 8081 is forwarded correctly using
 vega device start-port-forwarding --port 8081 --forward false.
For cloud development environments, add the following SSH configuration option:
Related topics
- Investigate Component Re-rendering Issues
- Identify UI Rendering Issues
- Inspect Traces in Vega Apps
- Measure App KPIs
- Monitor Network Traffic with Charles Proxy
- Detect Memory Leaks
- Debug Your App with Developer Menu Tools
- Set Up Fast Refresh
- Get Started with Amazon Devices Builder Tools for AI