Understand thread states
Threads can exist in various states, such as Running, Runnable, Runnable (Preempted), Sleeping, Uninterruptible Sleep, Stopped, Idle, and Exit. For an exact definition of each state, see Thread States in Monitor and Record Your App Performance.Identify causes of performance issues
Thread state visualization can provide insight into apps performance issues, such as increased latency, unresponsiveness, crashes, and inconsistent behavior. The following table lists possible causes of performance issues you can identify using thread state information.Use Vega Studio Performance Extension
Vega Studio Performance Extension provides thread state visualization in the Recording view of the Activity Monitor and Memory Monitor. To troubleshoot performance issues in your JS apps, complete the following steps:- Start a recording in the Activity Monitor.
- Replicate the problematic behavior in the app.
- Stop the recording to generate the recording view, which includes the Traces view with thread state information.
Analyze thread state data
To identify app performance issues:- Analyze the thread state data in Traces view.
- Examine if the thread state data corresponds to any of the previously mentioned causes: long-running threads, high CPU usage, or CPU contention.
Use Cases
The following examples show how thread state visualization can help troubleshoot and optimize app performance.Use case 1: Troubleshoot long-running threads due to inefficient algorithms
While testing VegaVideoApp, you experienced poor responsiveness issues when pulling up the Home Screen or any detail pages. To identify the issue, you started a recording in the Activity Monitor while replicating the problematic behavior in the app. When the recording stopped, the Activity Monitor generated a recording view, including the Traces view with thread state information. You examined the Traces, which showed the JS Thread was running for up to 5 seconds. This indicated long-running thread due to inefficient algorithms. You examined the CPU Profiler Flame graphs, where the
 DetailsScreen was taking 5 seconds due to the getClassics method.
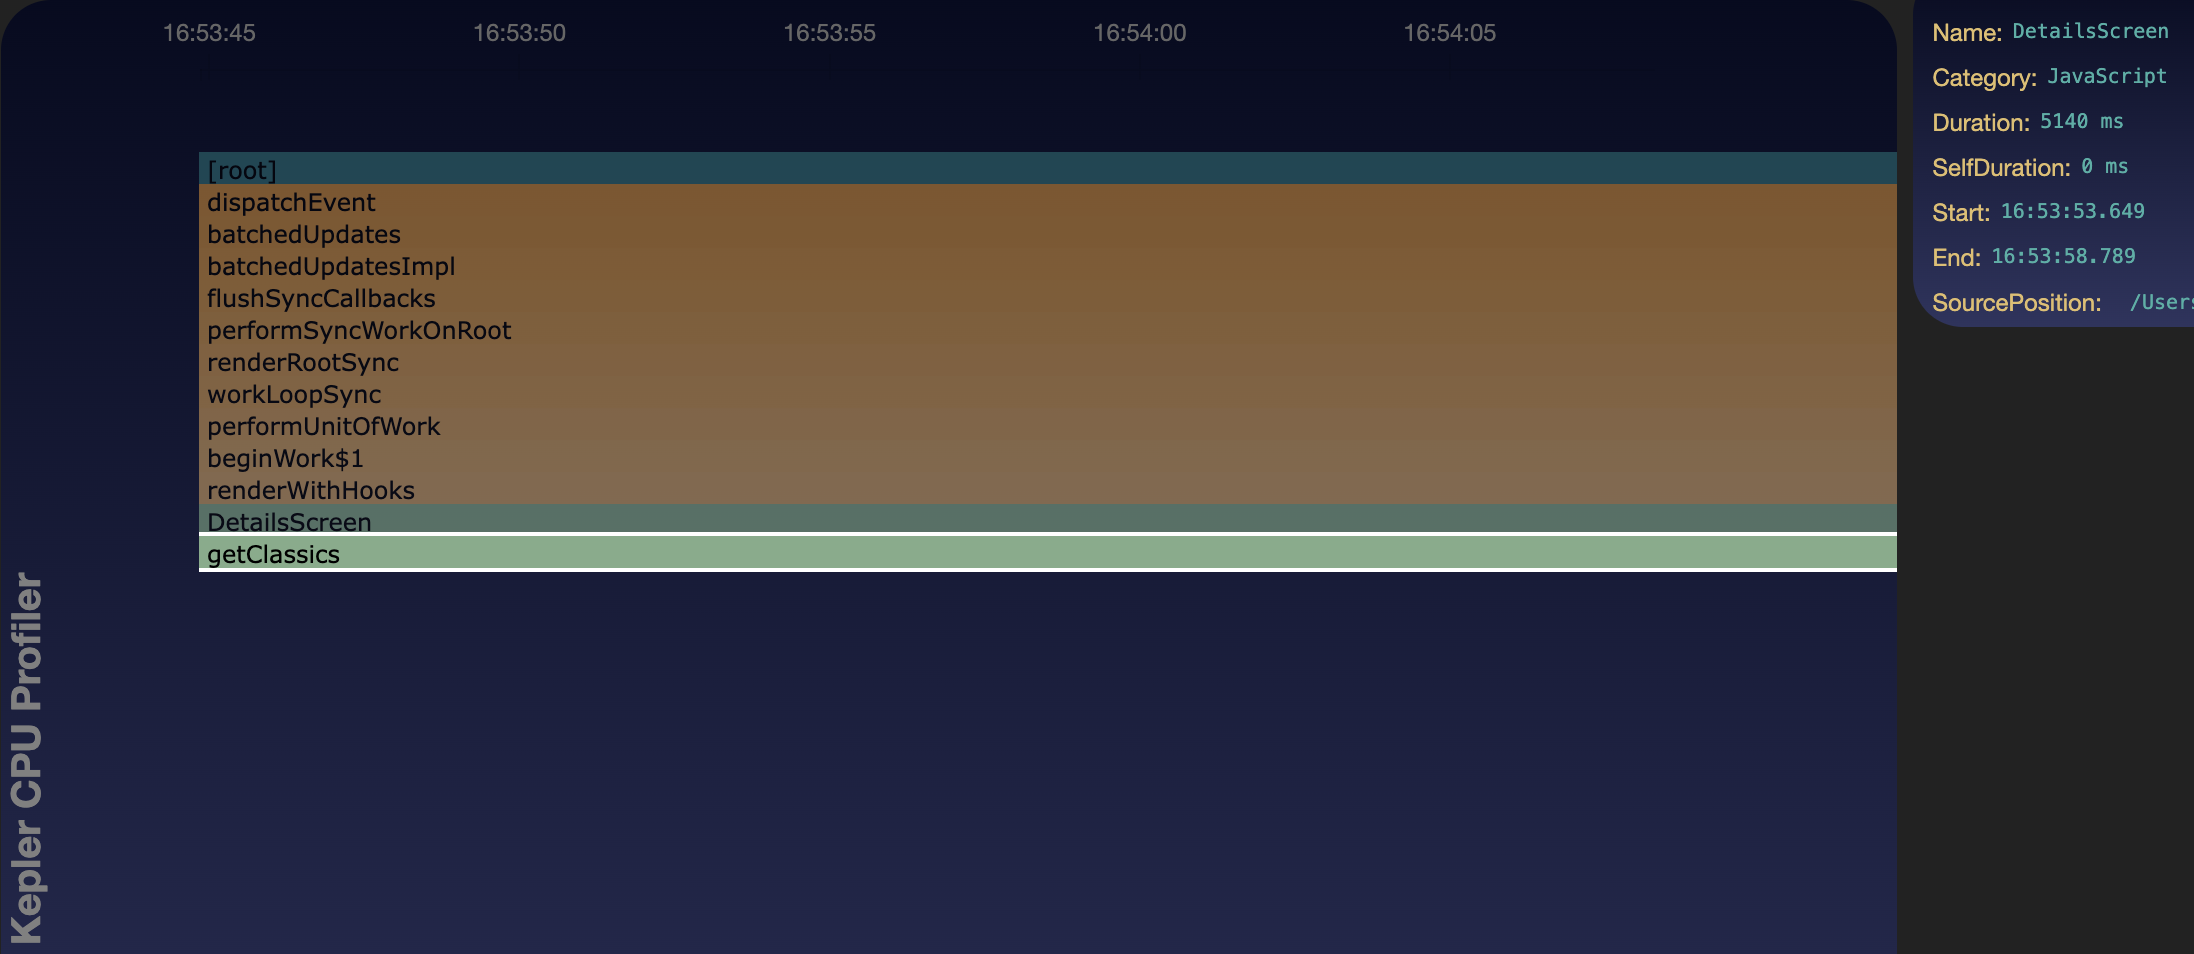 While revisiting your app code, you see inefficient code while sorting and filtering the data, causing a performance lag issue.

Use case 2: Troubleshoot high CPU usage in a scrolling app
You created a simple scrolling app using the React Native Flatlist component to display 200 rows with different colors. Using the Activity Monitor, you observed frequent “running” states in the thread state view during scrolling, showing high CPU usage. The CPU Profiler Flame graphs also showed high activity, suggesting the Flatlist component wasn’t functioning efficiently.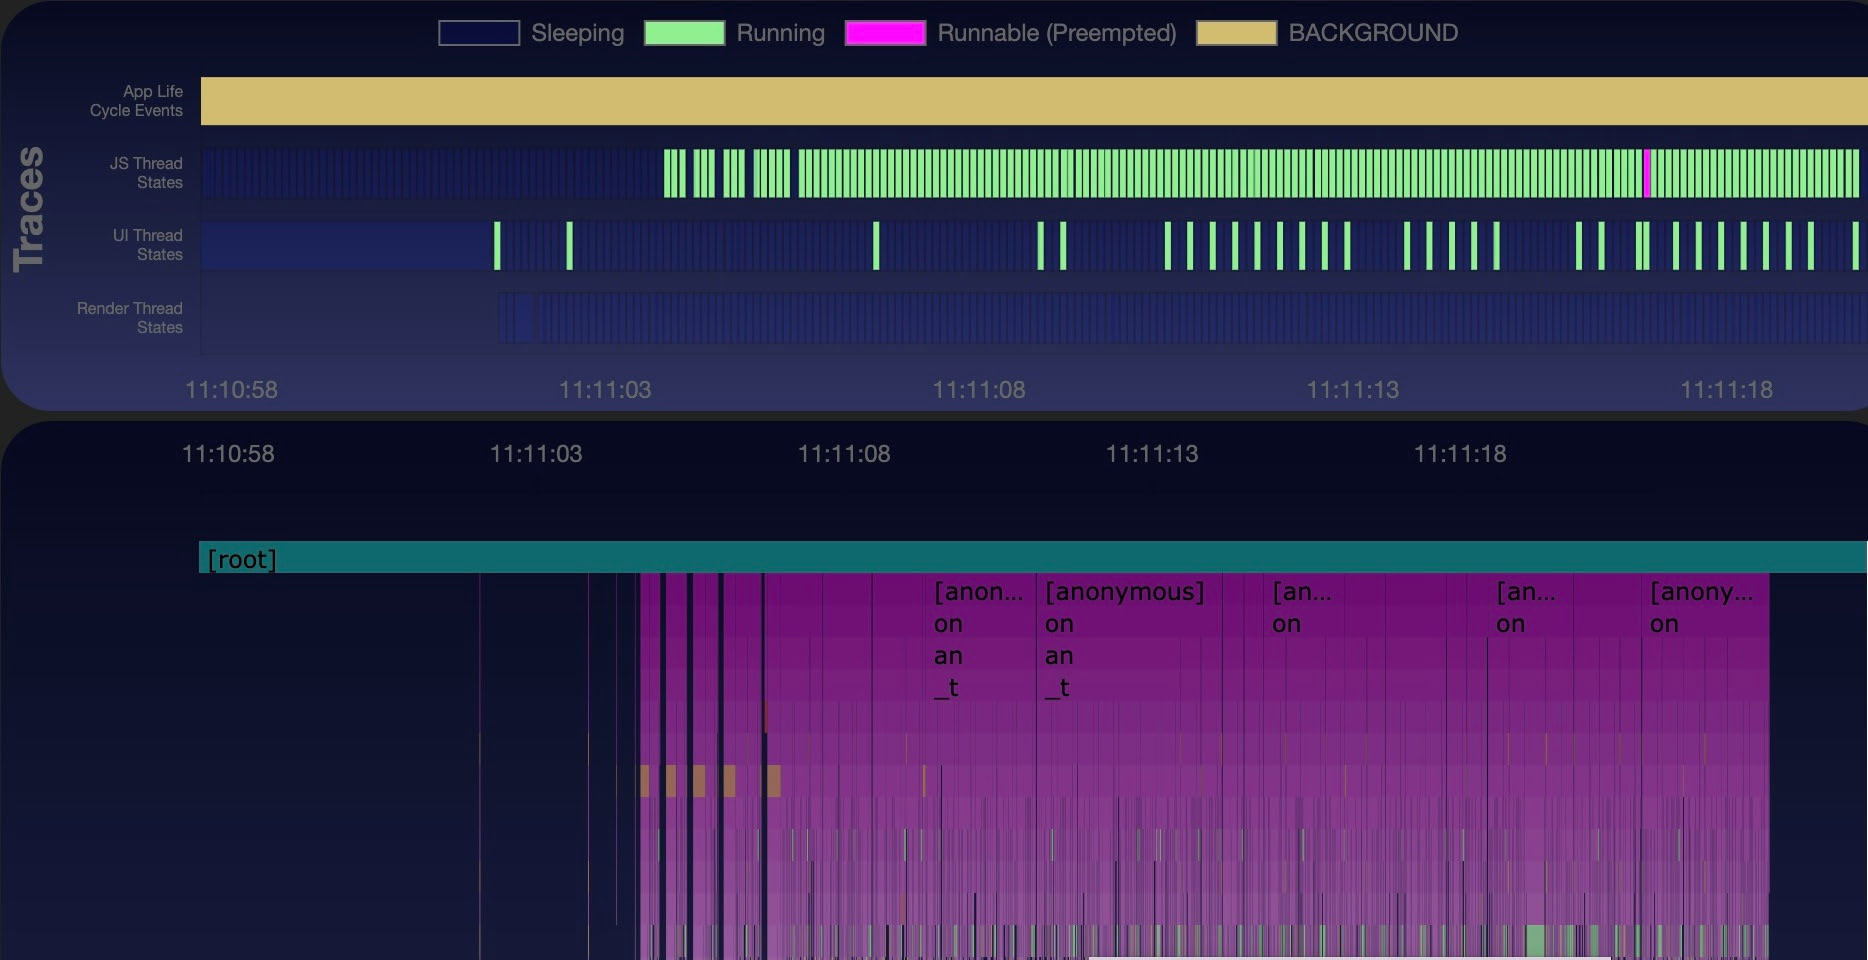 The following example code shows how to add Flatlist component in the app.
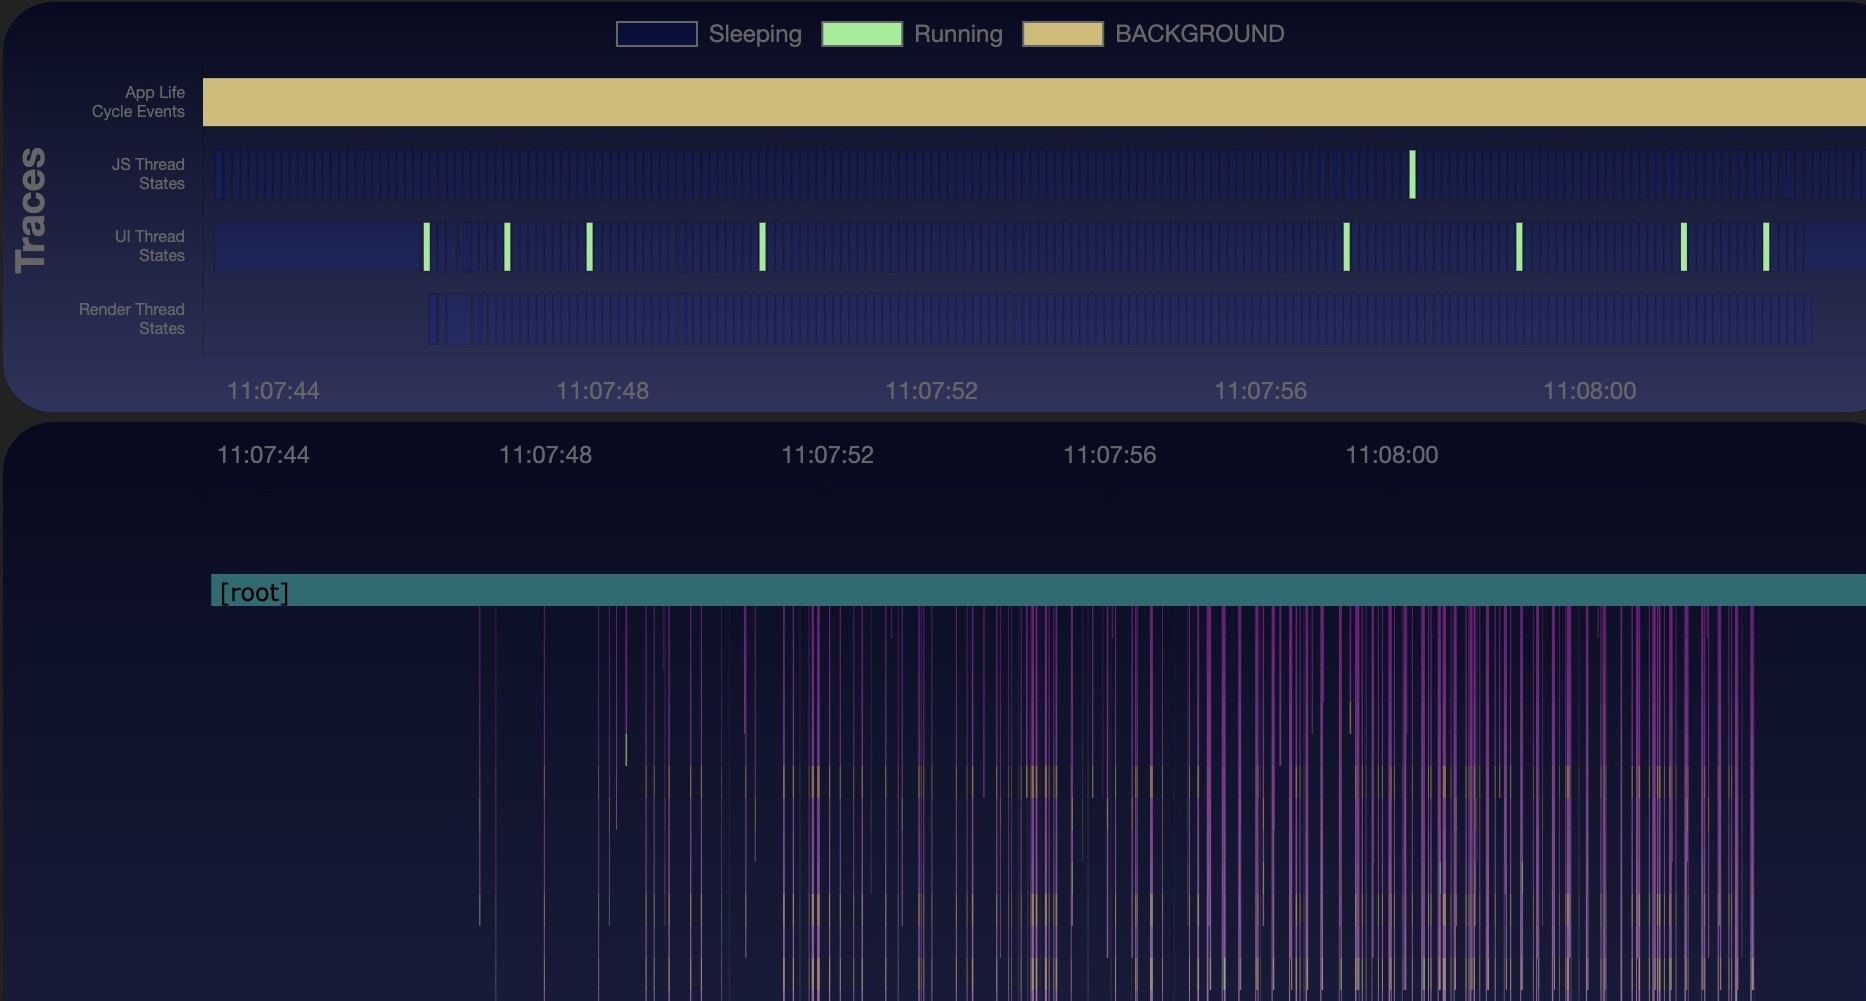 To read about the advantages of Flashlist over Flatlist, see Best Practices.
Related topics
- App Performance Best Practices
- Measure App KPIs
- Identify UI Rendering Issues
- Detect Overdraw
- Investigate Component Re-rendering Issues