Prerequisites
Before you proceed, make sure you complete the setup in Measure Fluidity and Foreground.Identify UI rendering jank
After you run the fluidity KPI test in Vega App KPI Visualizer, the system generates artifacts that help identify causes of UI lag. These artifacts include a fluidity graph, CPU profile graph, and Perfetto trace.Understand the Fluidity graph
The fluidity graph visually represents your app’s rendering performance over time. When examining the graph, look for drops in fluidity that indicate potential performance issues. These drops often correlate with specific events or code execution that cause lag in the UI.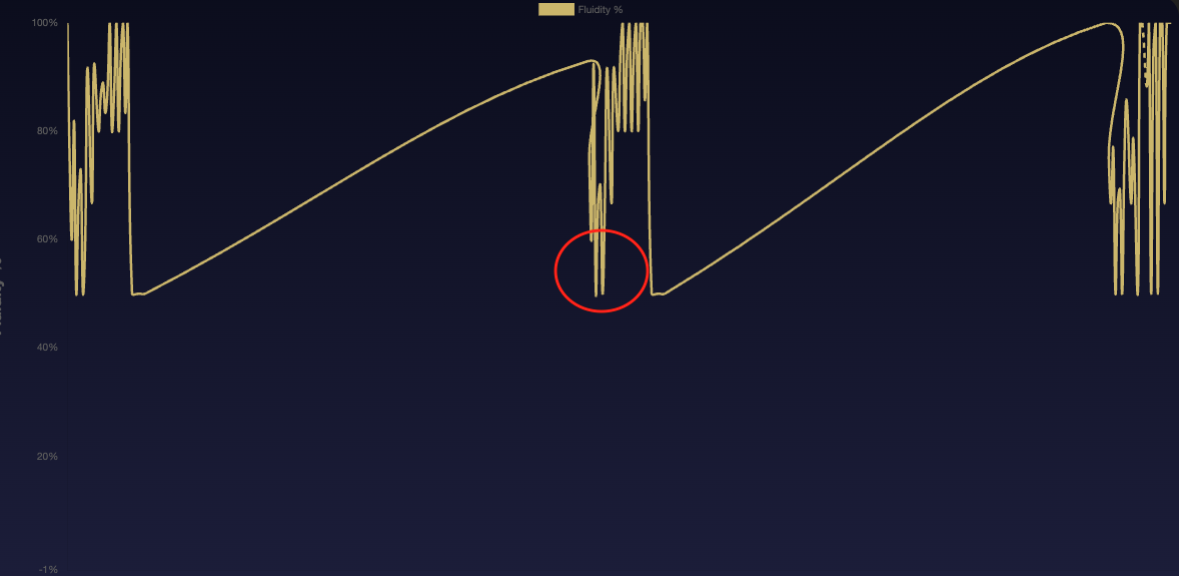 To identify the cause of drops in fluidity
- Examine the Perfetto trace.
Analyze the CPU profile graph
The CPU profile graph shows the time spent in different functions within your app. When you see performance issues in the Fluidity graph, expand the CPU profile graph at the timestamp. The expanded view is called a flamegraph, which is a visualization of the CPU profile that shows which functions use the most processing time.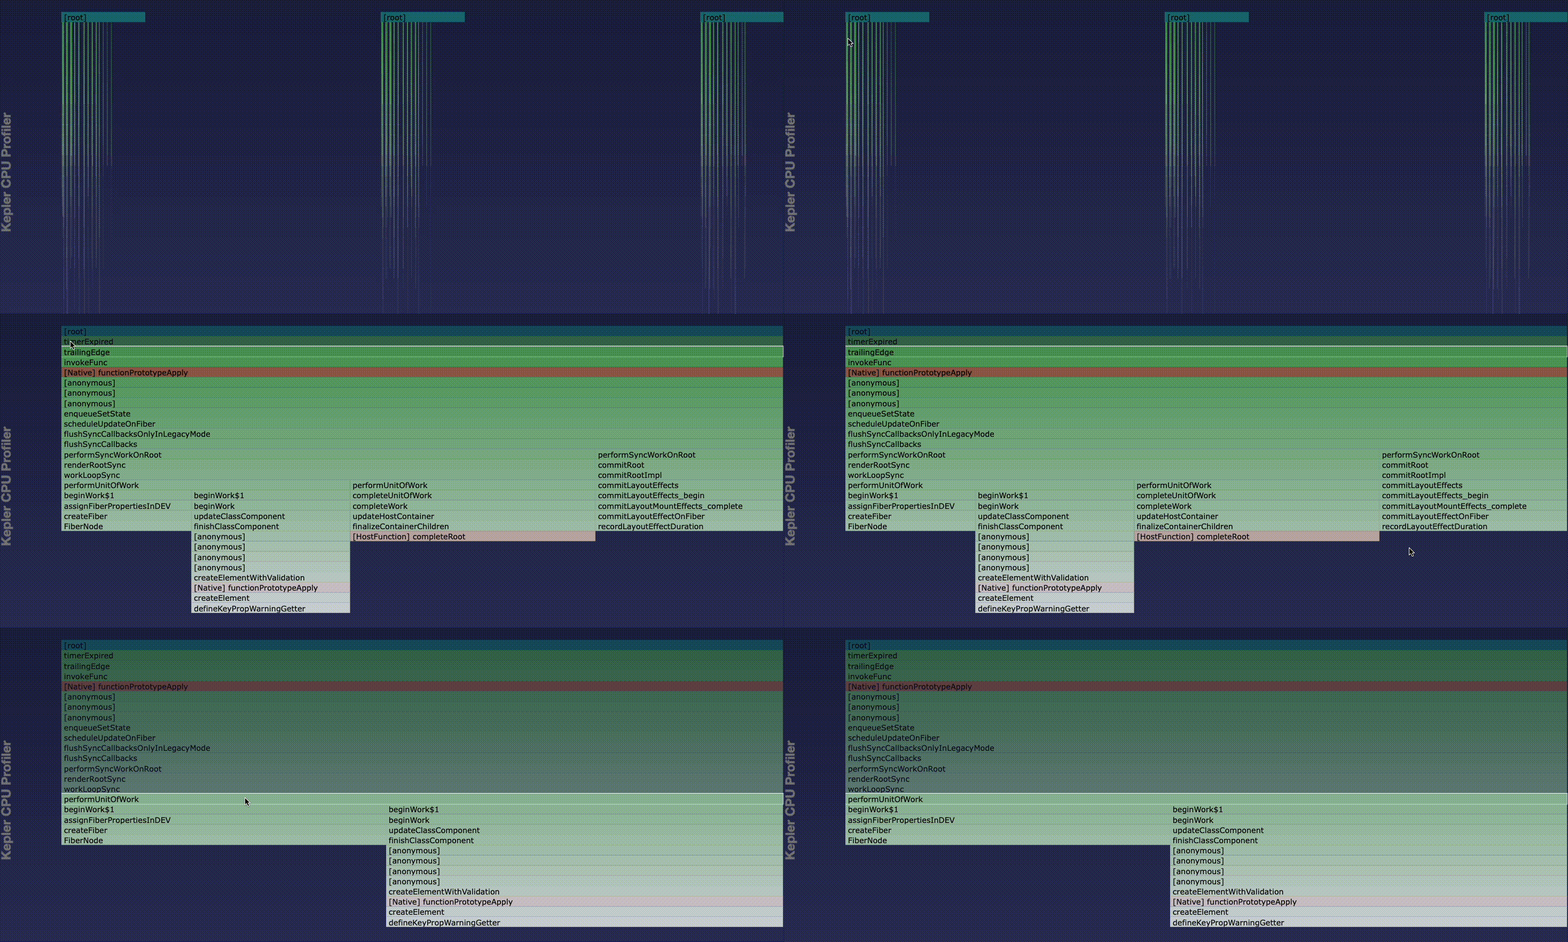 To collapse the flamegraph
- Select the root bar.
- If the view remains expanded, use the
Developer: Reload Webviewscommand pallete.
Work with Perfetto traces
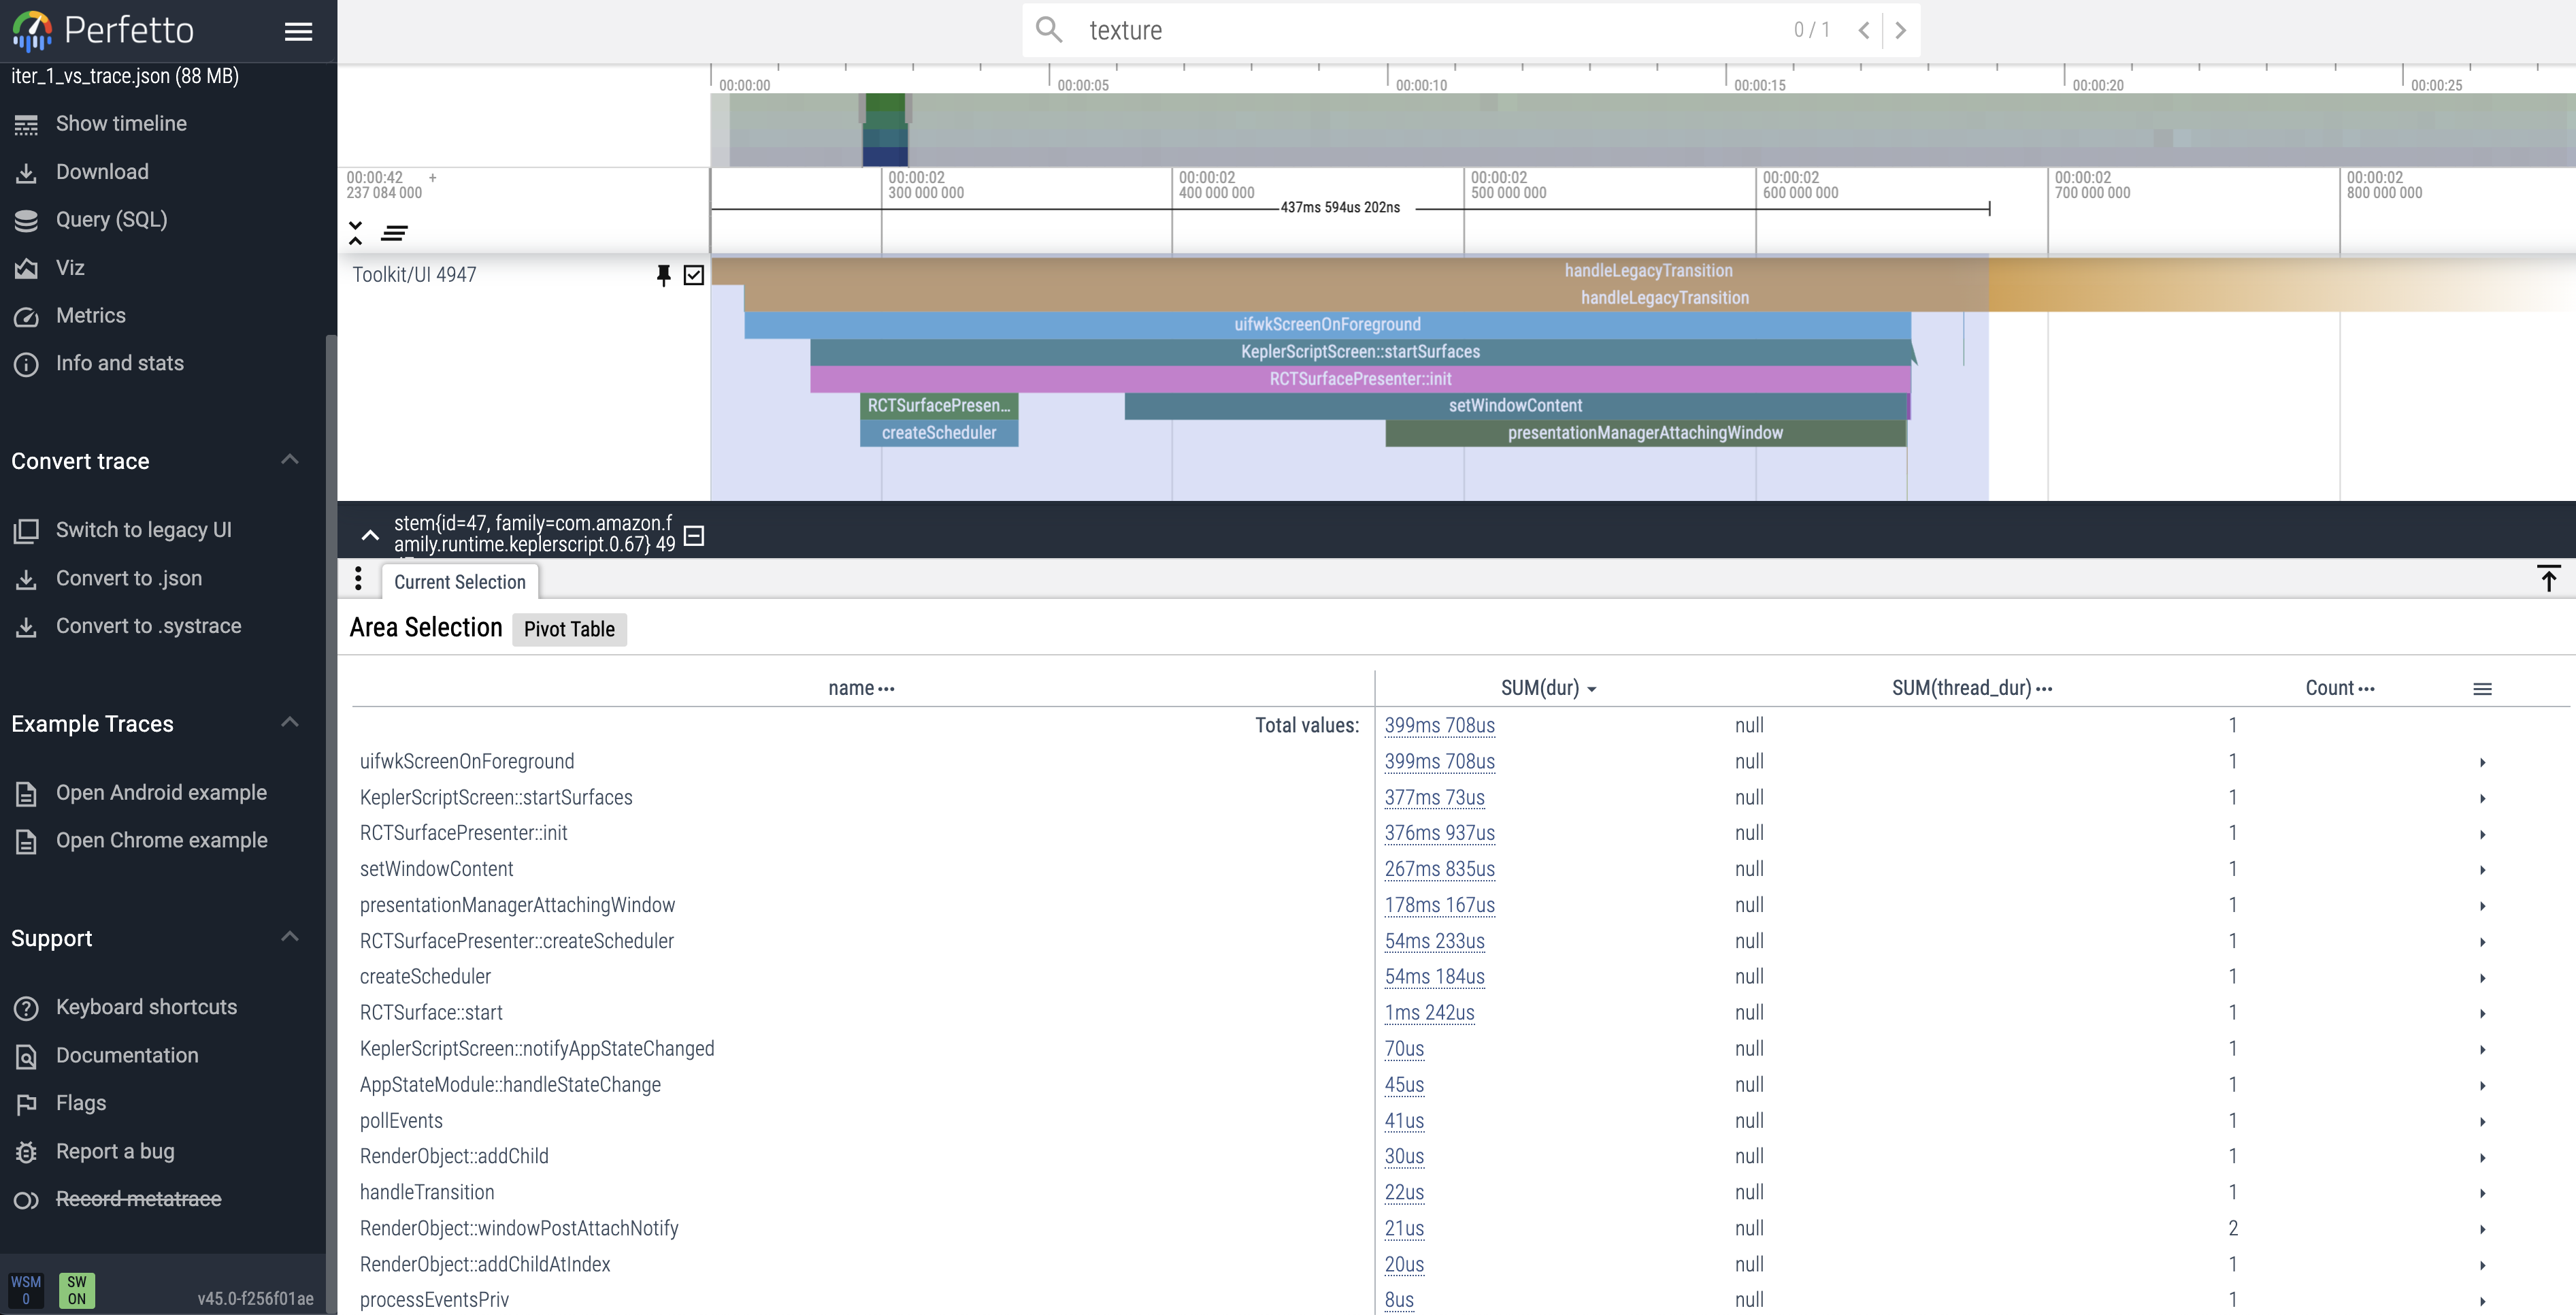
Perfetto is an open-source tool that records system traces with minimal impact on performance. When you start a fluidity test, Perfetto automatically collects traces on the Vega device that you’re testing. After test completion, the trace files download to your workstation. You can find the trace files in the test output directory. Each file is in the following format:iter_3_vs_trace.protobuf
To analyze system behavior during testing
- Open the trace files Perfetto UI.
- To identify UI rendering issues, examine the
Toolkit/Render threadtrace. - Look for extended or recurring events that might cause performance degradation.
Common cause of janks and resolution
Frame size mismatch
When rendering frames, the system loads bitmaps to the graphics processing unit (GPU) as an OpenGL texture. An OpenGL texture is an image used in rendering graphics, typically stored in the GPU’s memory. If the frame size and display resolution don’t match, the following actions occur:- The GPU must map the frame pixels to the display.
- If the frame is larger than the display, more pixels than needed are loaded onto the GPU.
-
In Perfetto (System Trace), locate the
Tools/Renderthread around the time when the lag was observed. -
Check for delays in the render process.
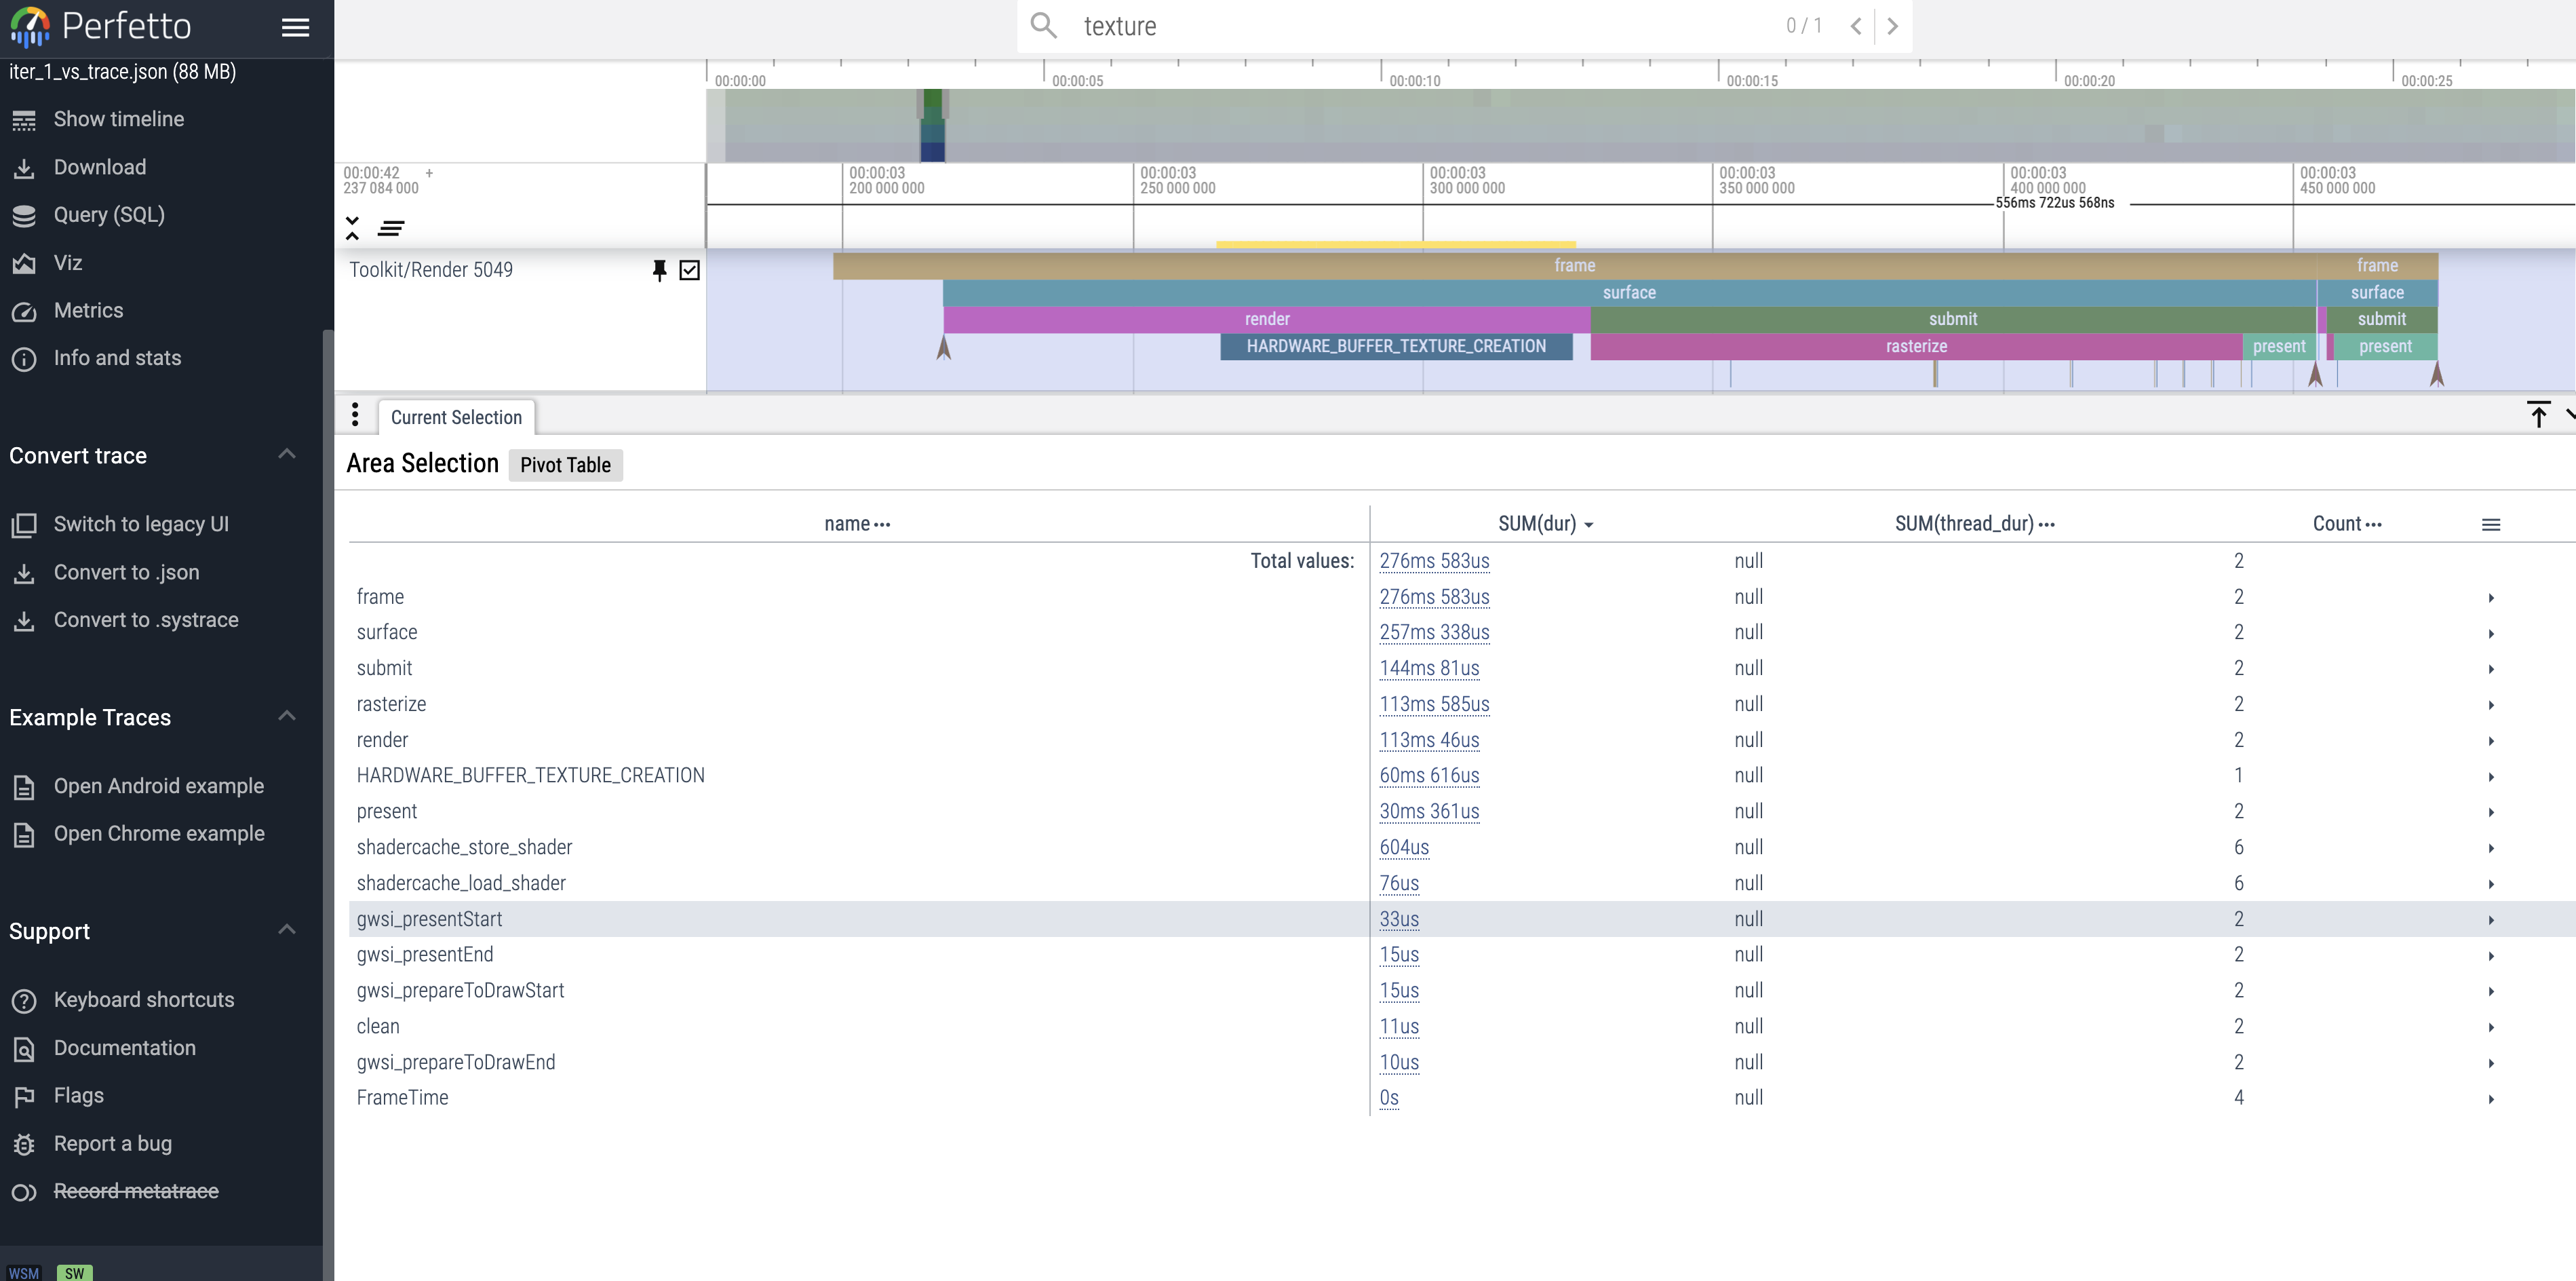
- Verify that the frame width and height match the target device’s display size.
Frame overdraw
Frame overdraw occurs when an app renders the same pixel multiple times within a single frame, wasting computational resources. This happens because the app draws new objects over previously drawn objects without first clearing the screen. To detect app overdraw- Follow the steps in Detect Overdraw.
Add custom trace with React Native Systrace
The Vega SDK supports the React Native Systrace API so that you can add trace markers and measure the time elapsed between function calls in your app’s source code. Custom traces help you pinpoint performance issues in specific parts of your code. The following code block shows how to add trace markers.Best practices
To avoid janks or slow rendering, follow the Vega app guidelines in App Performance Best Practices.Related topics
- ▶️ How to use Perfetto Traces to Debug Performance Issues
- 💬 Community: How to improve UI Fluidity
- App Performance Best Practices
- Measure App KPIs