Step 1: Identify the crash reason
- Open the aggregated crash report From the device, download and open the aggregated crash report (ACR).
-
In the ACR file, look for
CrashReason:SIGSEGV. -
Confirm a JavaScript heap overflow
To confirm a JavaScript heap memory overflow, check the app logs for
HermesGC OOM.
Step 2: Identify memory leak scenarios
- Open Visual Studio (VS) Code.
- Start the Memory Monitor. Follow the steps in Inspect your app memory consumption.
-
Track the JavaScript heap graph for 200-MB threshold approaches.
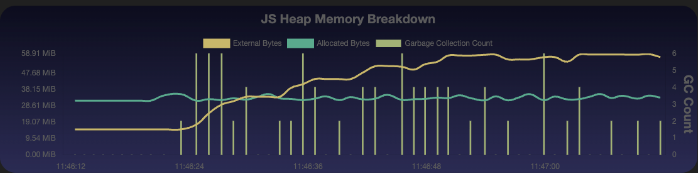
- Record a session to capture crash scenarios. Follow the steps in Record your app memory breakdown.
Step 3: Capture JavaScript heap snapshots
-
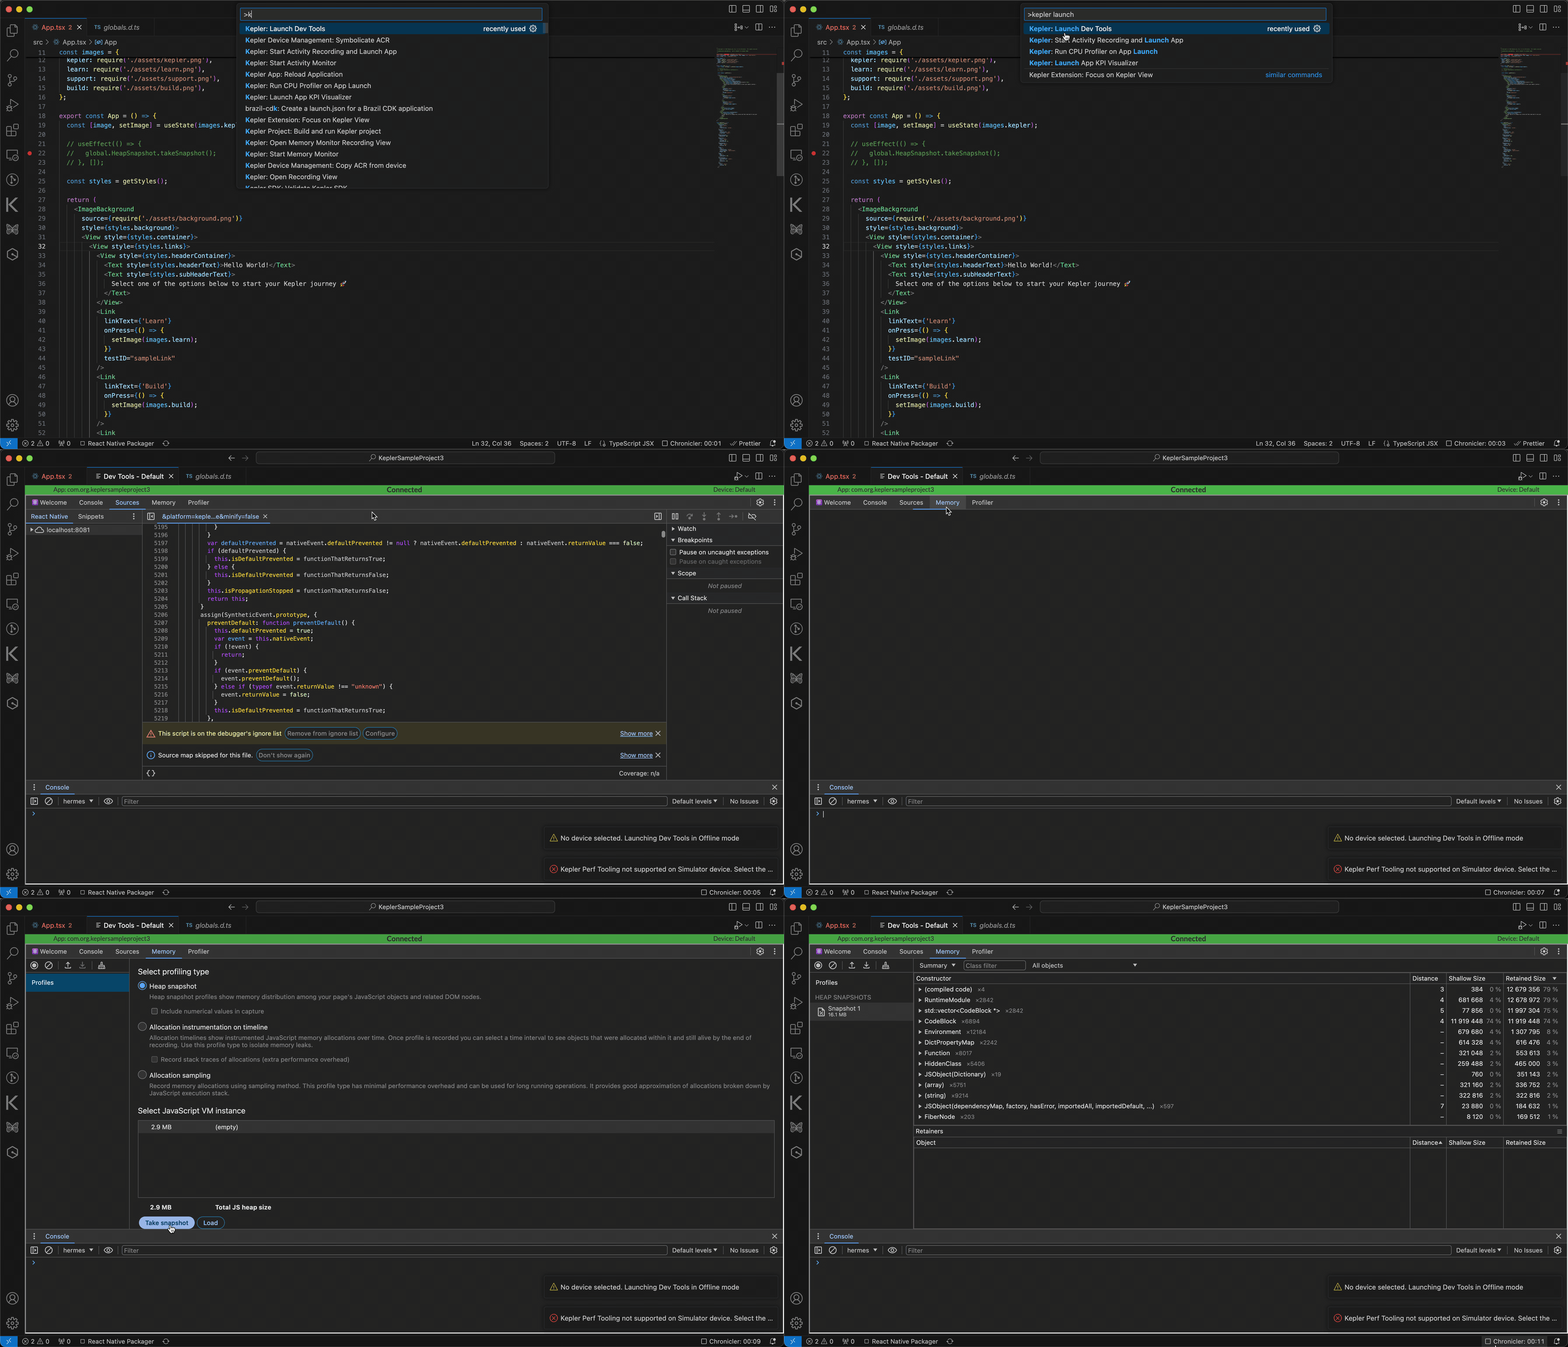
Attach Chrome DevTools
Attach Chrome DevTools to your React Native for Vega app. Follow the steps in Start Chrome DevTools.
-
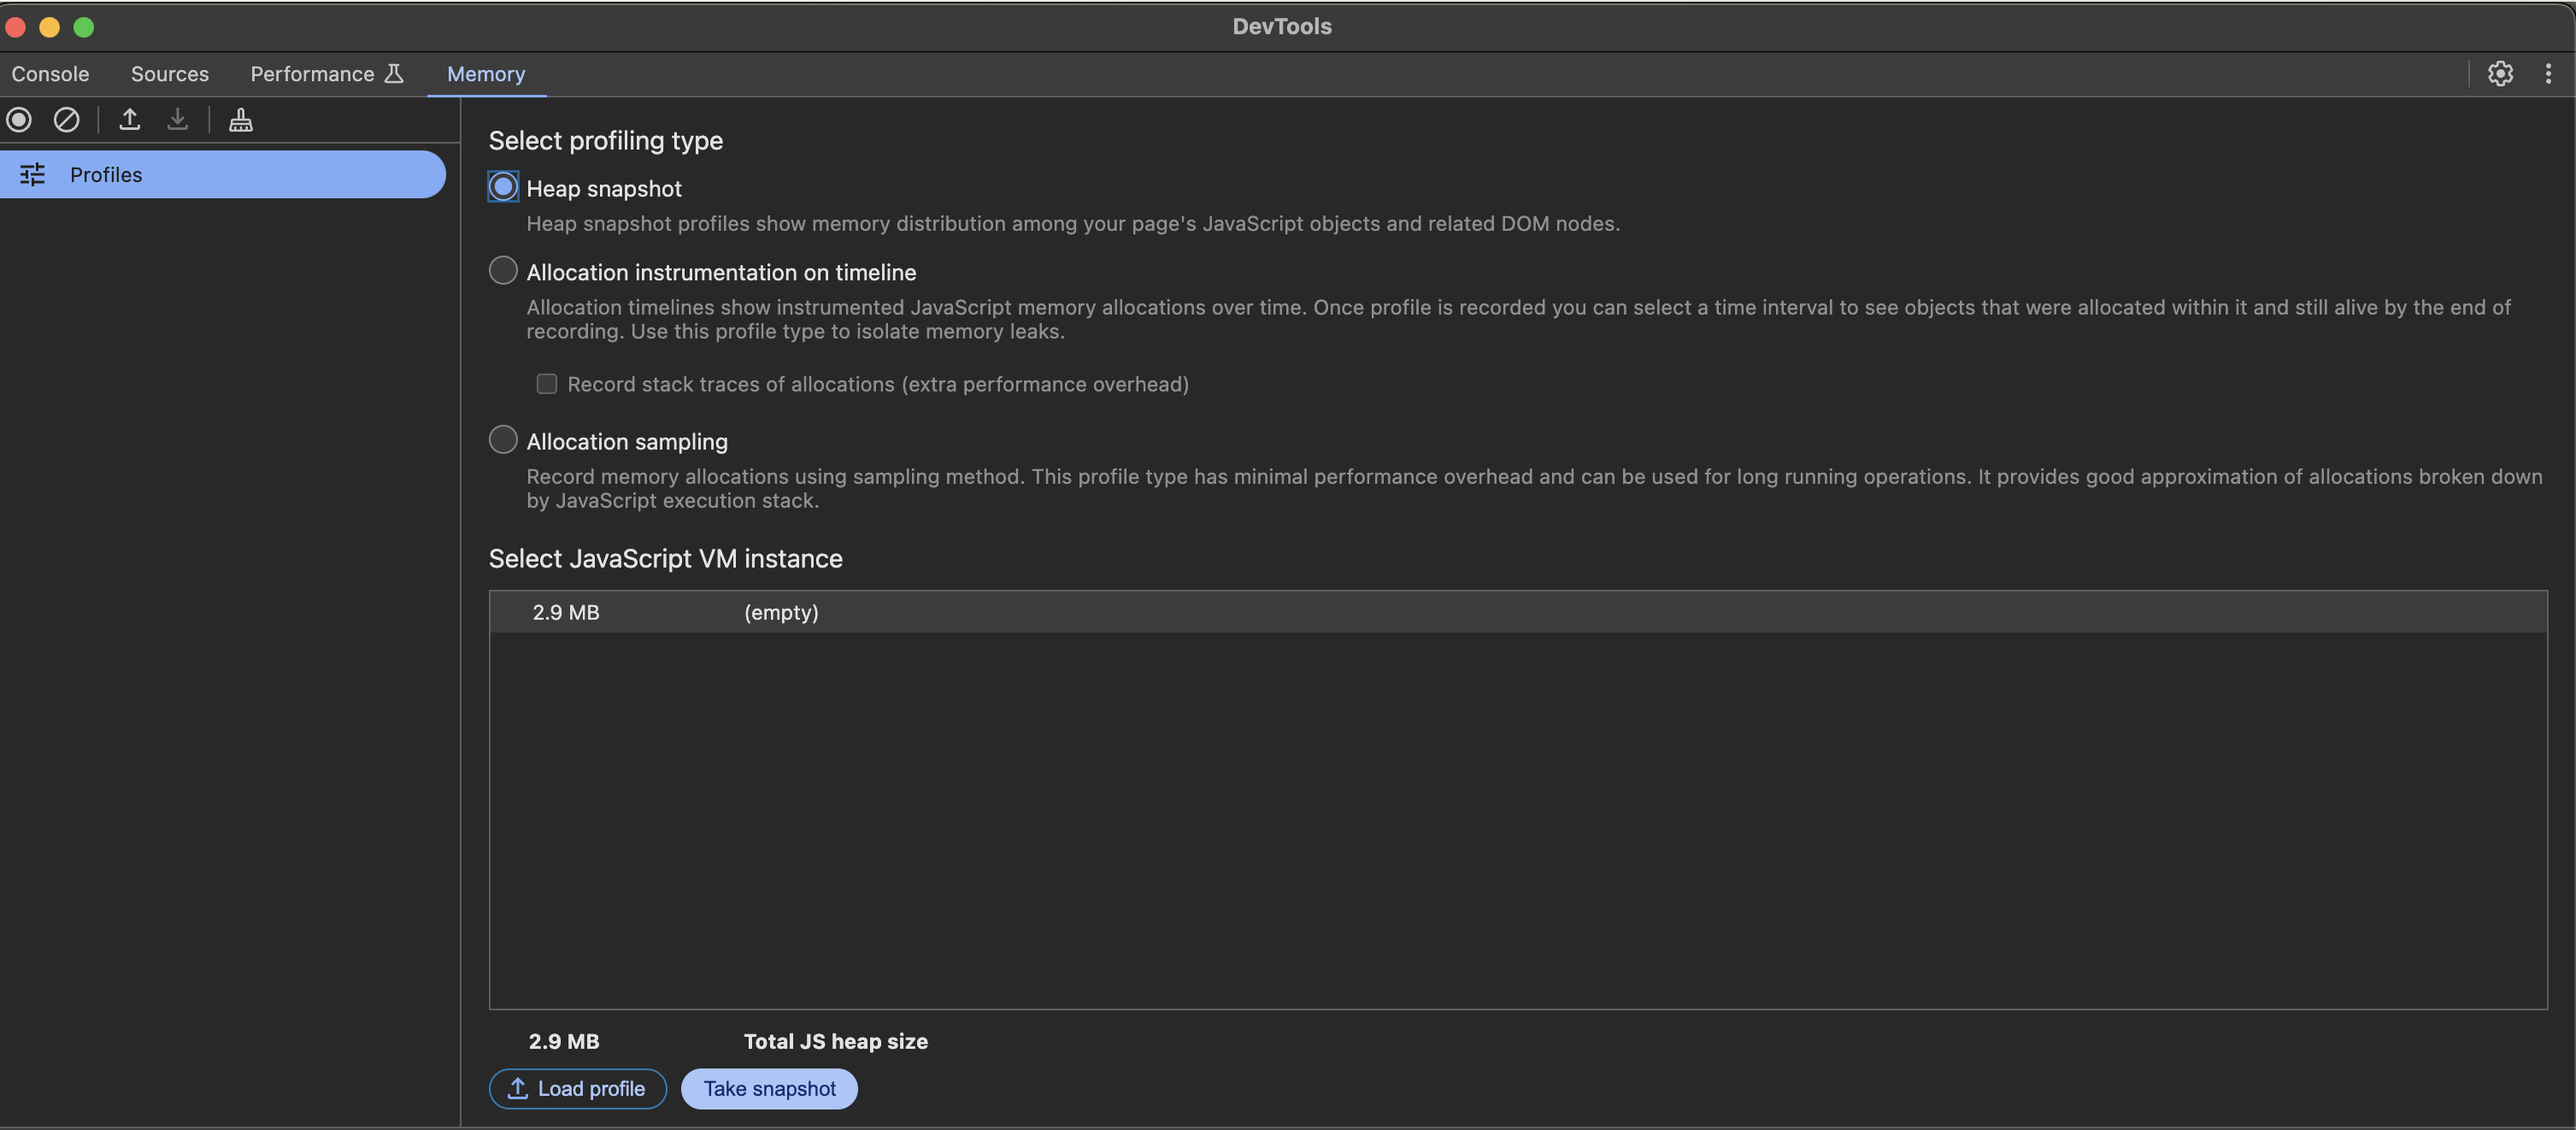
Navigate to the Memory tab and select Heap Snapshot.
-
Click Take snapshot.
The following image is an example of a heap snapshot.
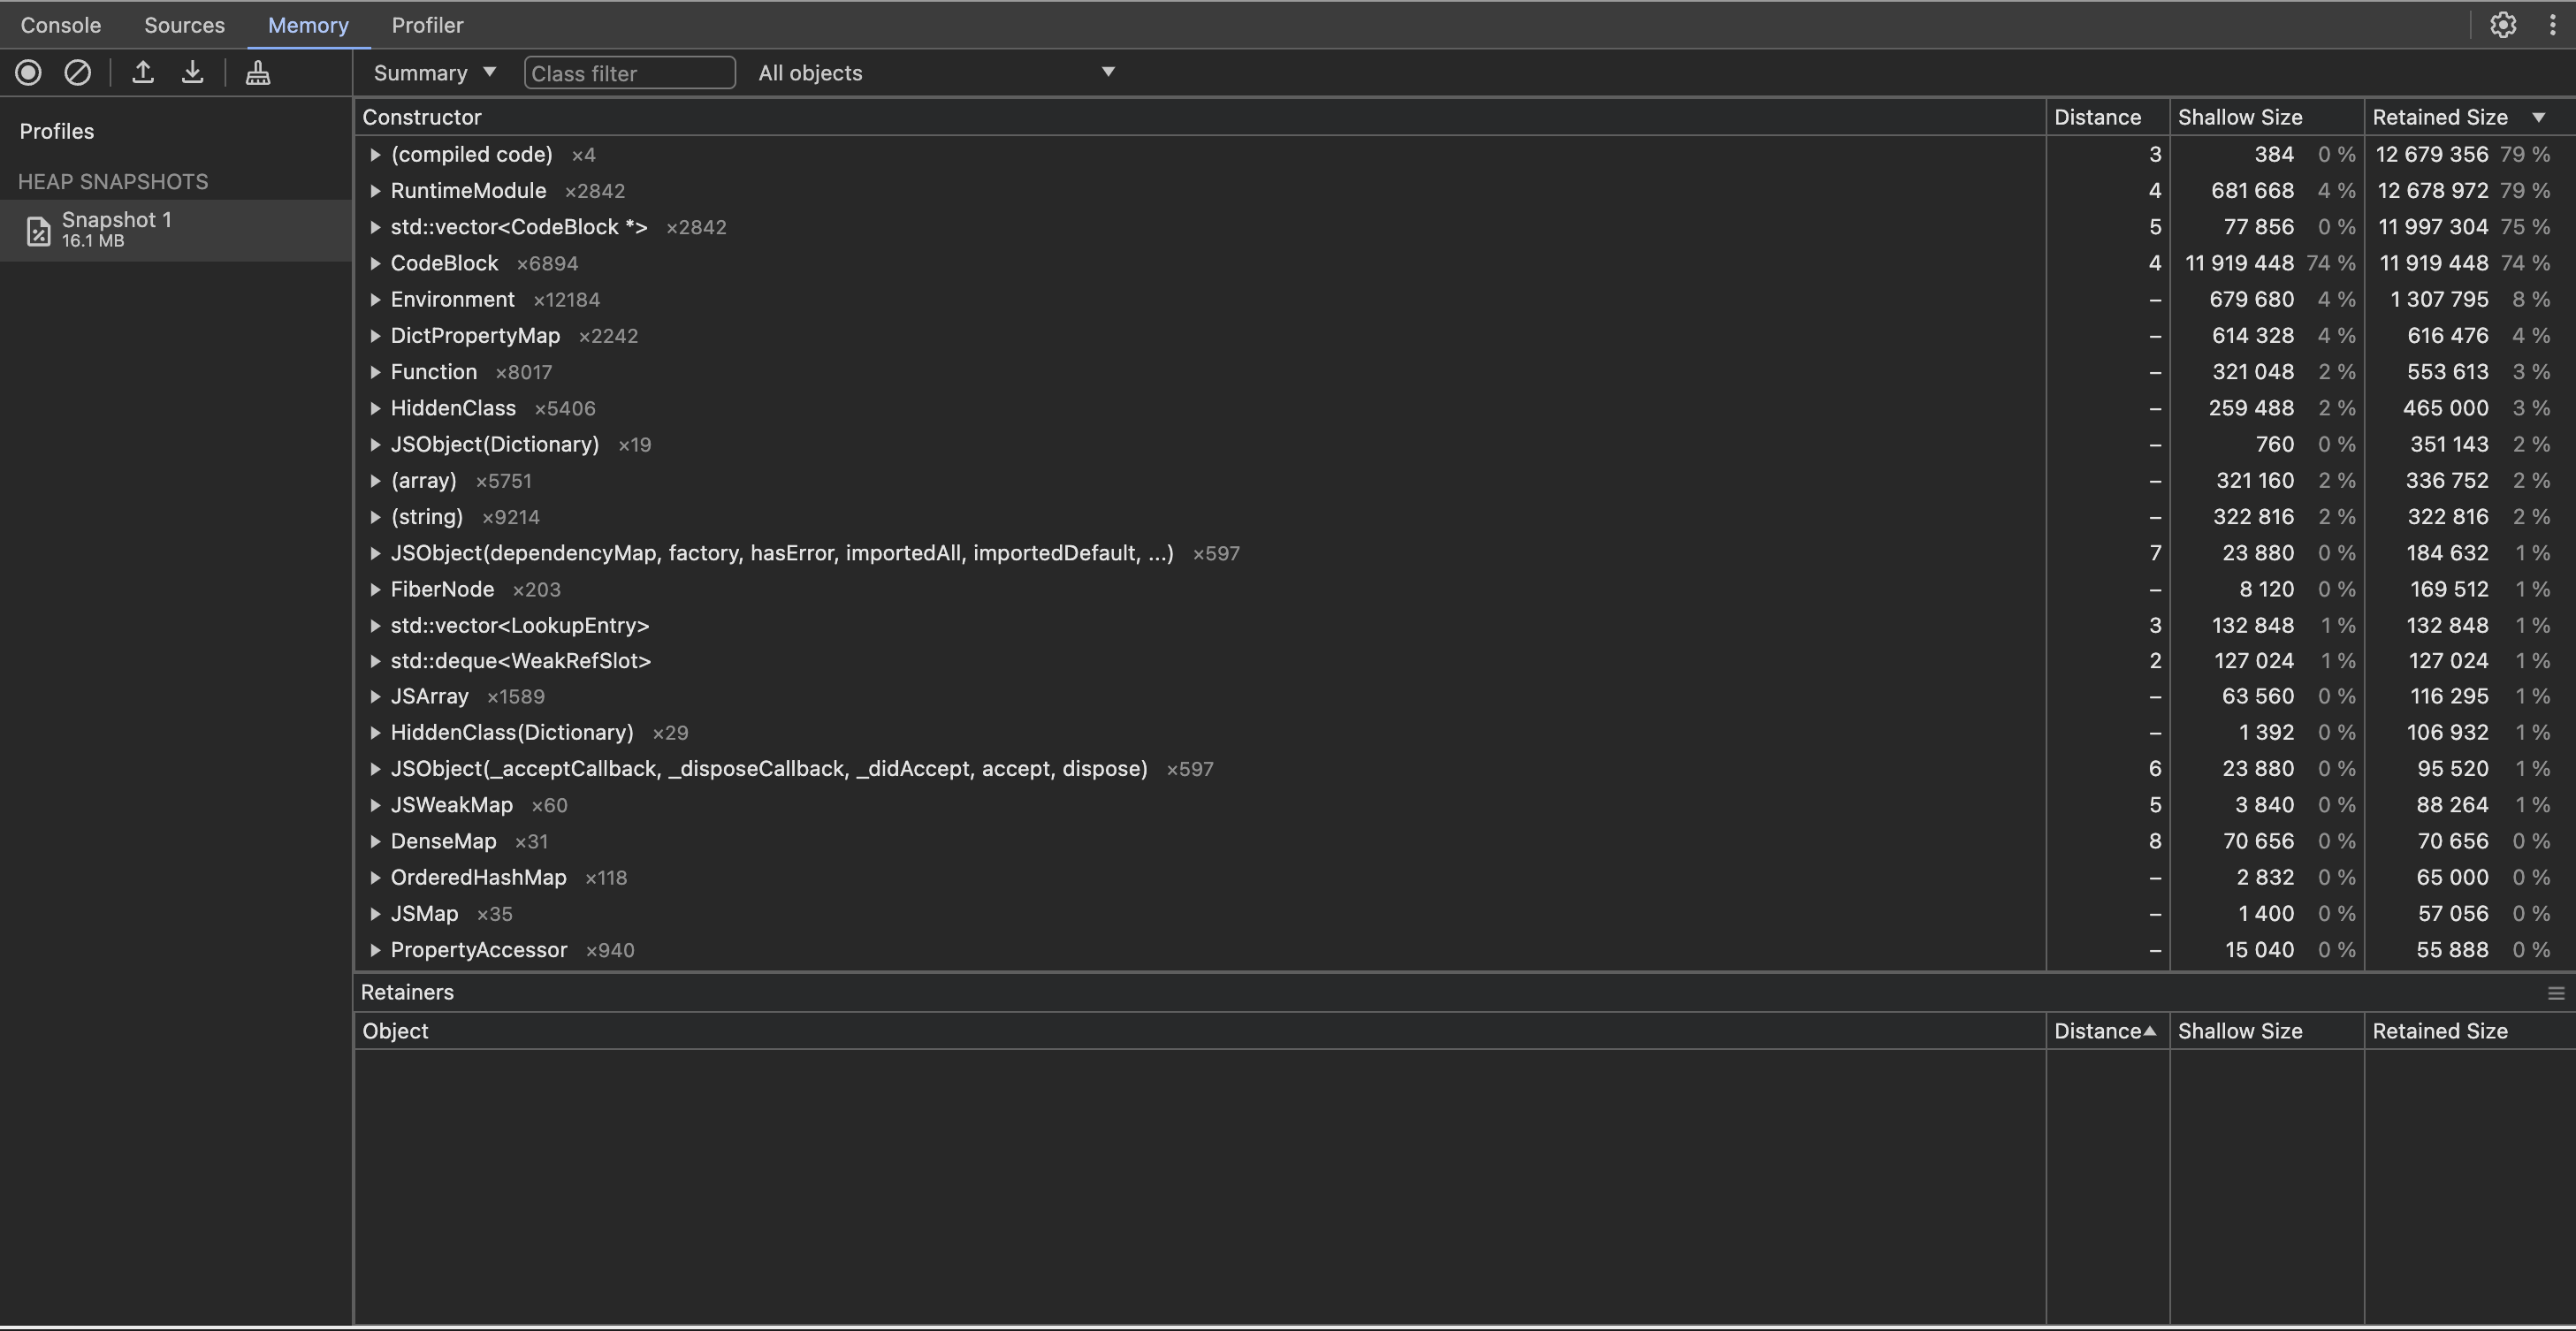
- To download the snapshot onto your host machine, click the down arrow.
Step 4: Analyze JavaScript heap snapshot
Analyze JavaScript heap snapshots using Memlab or Chrome DevTools.Analyze with Memlab
-
Install Memlab:
-
Run the analysis:
Memlab compares three heap snapshots:
- Baseline - The initial state
- Target - The state after the potential leak
- Final - The state after cleanup
--trace-all-objectsargument marks all target page objects as potential leaks.memlab find-leakscompares the three heap snapshots and provides a summary in a table format: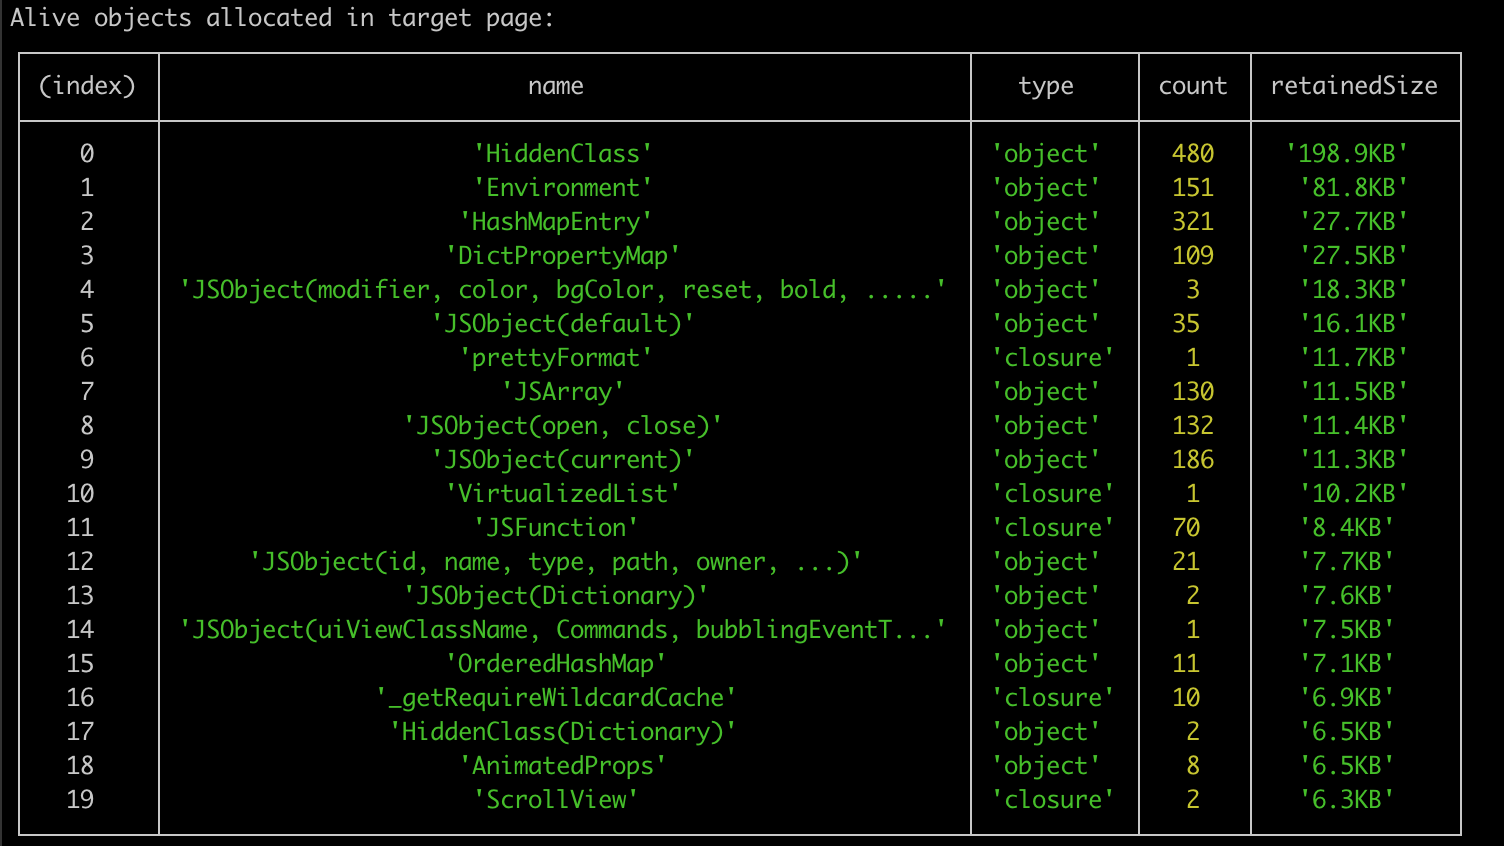
- Find uncleared objects from the table.
- Check code for deallocating persistent objects.
-
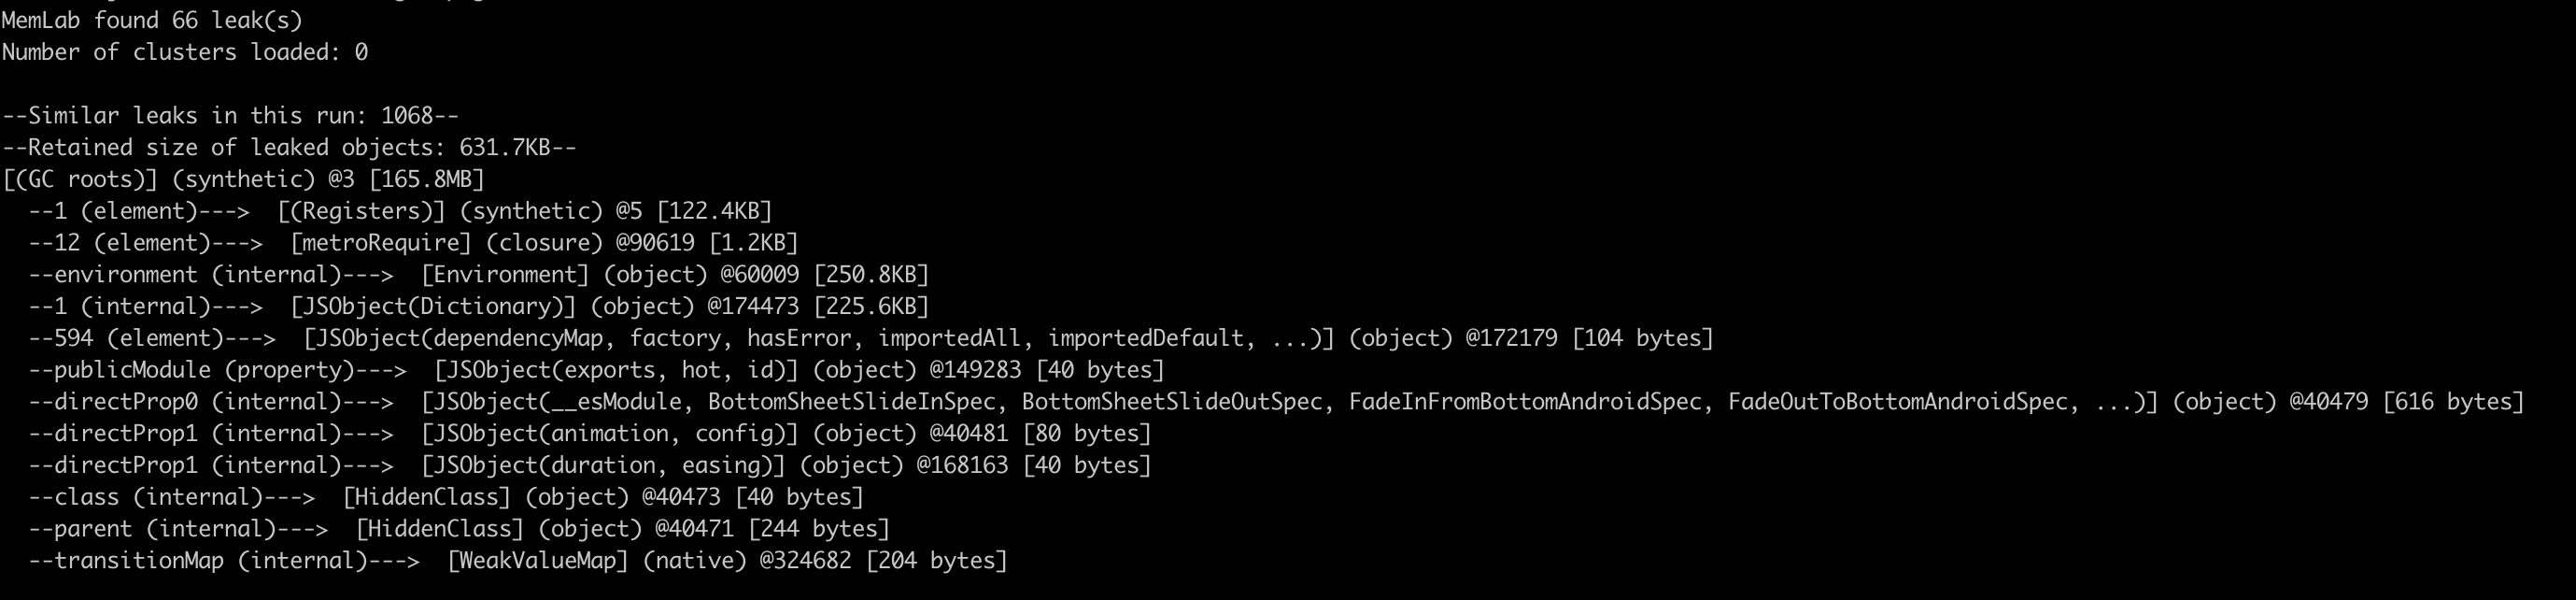
Review retainer traces.
Memlab ranks leaked objects on retained sizes. Use retainer traces to locate leaked objects in the object tree.
Analyze with Chrome DevTools
- Open Chrome DevTools and go to the Memory tab.
- Upload your JavaScript heap snapshot.
-
Analyze the JavaScript heap snapshot using different views:
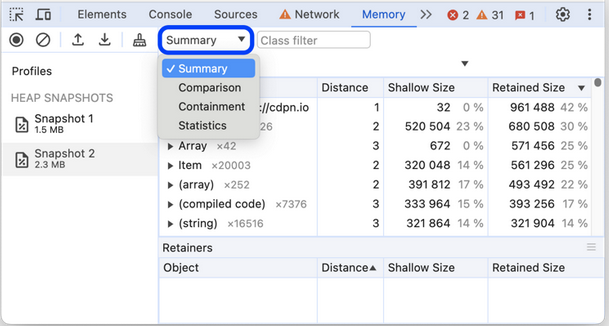
- Sort by Shallow Size to find the heaviest objects
- Sort by Retained Size to identify the most impactful objects
Related topics
- Monitor CPU Usage
- Measure Performance with Chrome DevTools
- 💬 Community: How to check if my app is running out of memory?
- 💬 Community: Log script for bug reports