Run your React Native for Vega app
Follow these steps to start debugging:-
Open the command palette in Vega Studio:
Mac:
Shift+Command ⌘+PLinux:Ctrl+Shift+P -
Enter Vega App: Run the current Vega app.
This command:
- Starts the metro packager (a JavaScript bundler for React Native)
- Sets up port forwarding between your device and host computer
- Launches your app on your device
Start CDT
Start CDT from Vega Studio using the integrated debugging experience. Complete the following steps:- Connect your Vega device to your development machine.
- In Visual Studio Code (VS Code), go to the Vega Studio panel.
- Select your project from the Vega section.
-
Select
Debugfrom the Build Modes section. - Select a Fire TV Stick device or Vega Virtual Device from the Devices section.
-
Run your app for debugging.
a. Follow the steps in Run your React Native for Vega app.
b. Wait for the app to run successfully.
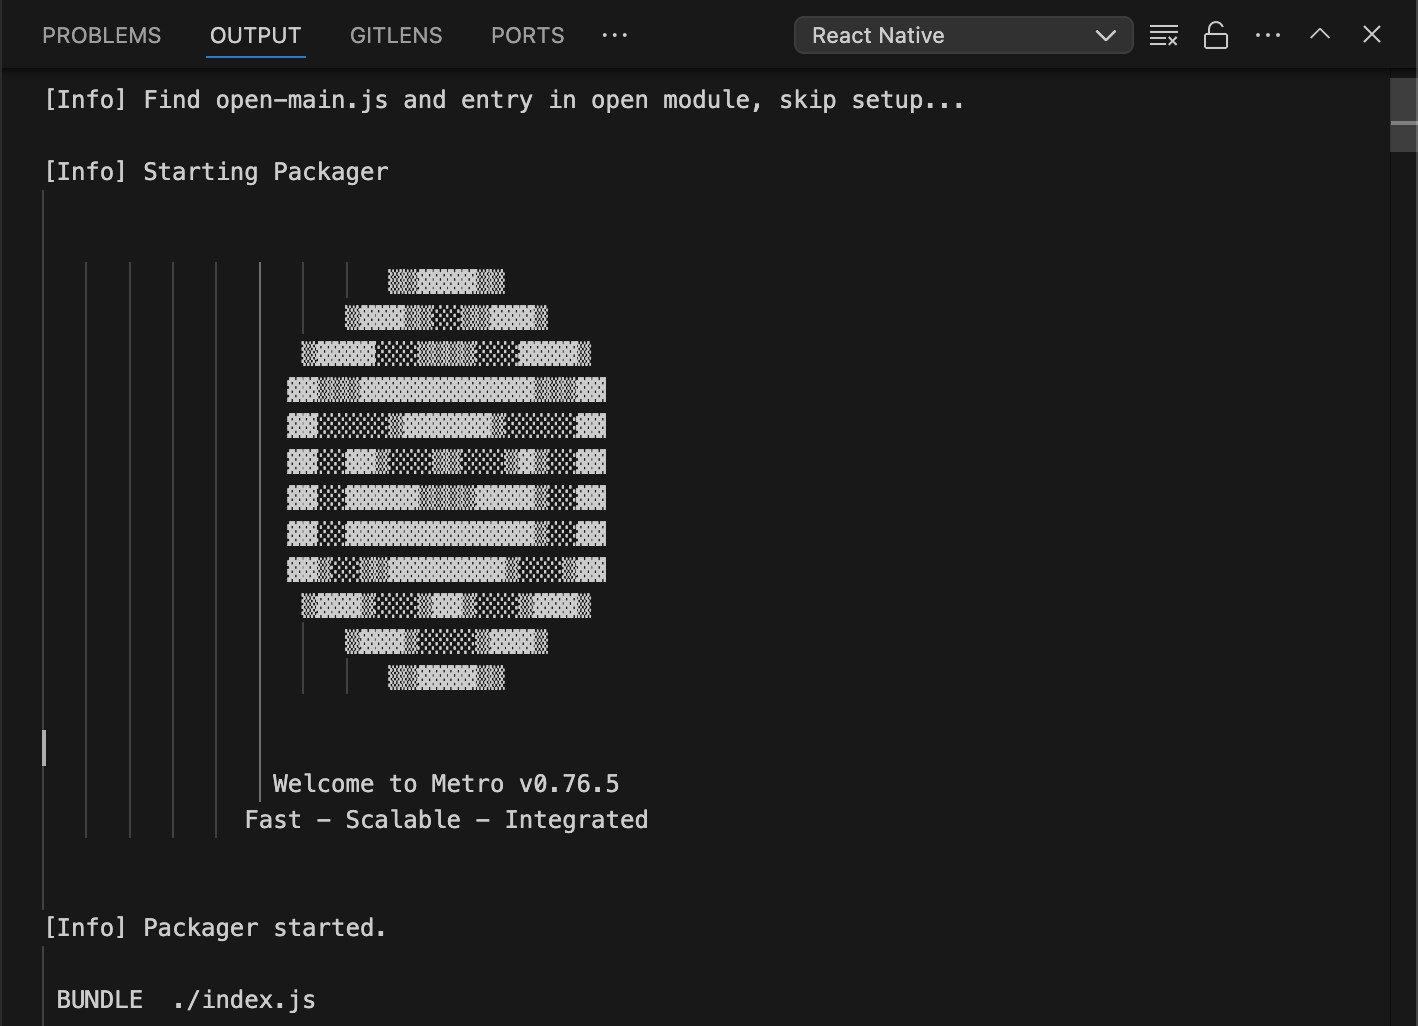
c. Verify that the React Native Packager is connected.
If the packager doesn’t connect, restart Metro by running Vega App: Run the current Vega app from the command palette again.
d. Navigate to the VS Code Output window.
e. Select React Native from the drop-down list.
-
Launch CDT.
a. Open the command palette.
Mac:
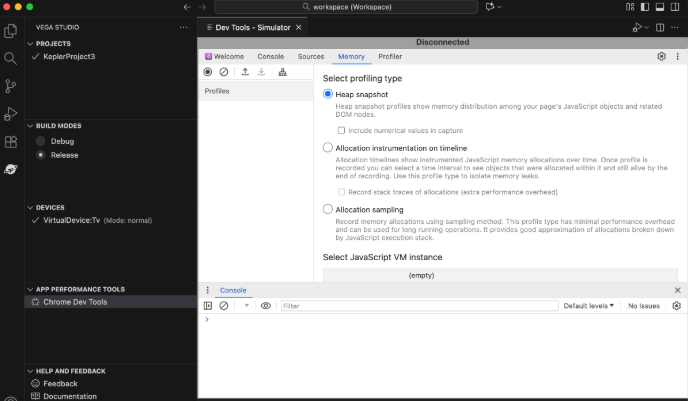
Shift+Command ⌘+PLinux:Ctrl+Shift+Pb. Enter Vega: Launch Dev Tools and press return for Mac or Enter for Linux.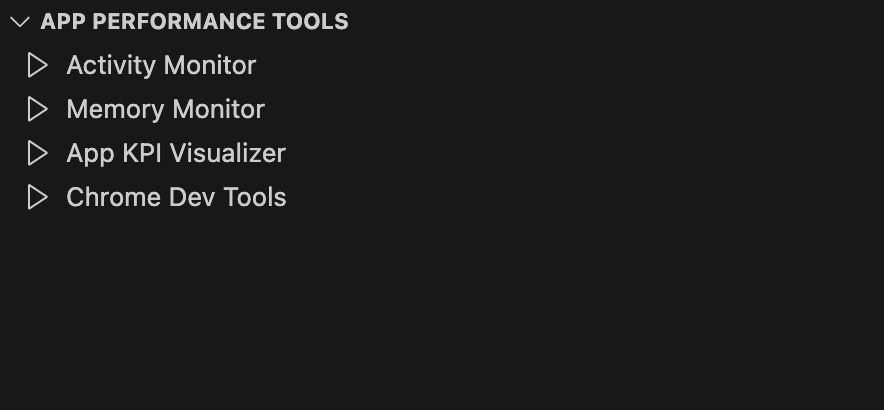 You can also select the Chrome Dev Tools from Vega Studio > App Performance Tools.
-
When you start CDT, a progress bar appears in a new window. When loading completes, CDT opens in that same window. The Sources and Console tabs become active, and your app’s JavaScript files appear in the left panel.
If CDT fails to connect to the app on your device, you see Disconnected at the top of the window.
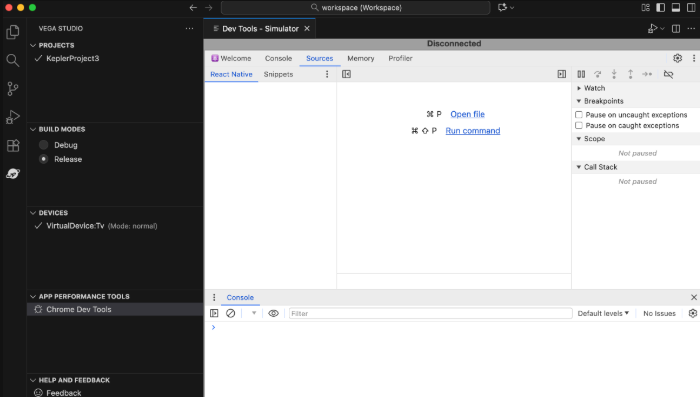 If CDT disconnects due to Splash Screen display, app restart, or other reasons, close the Dev Tools tab in Vega Studio. Then follow the steps in Start CDT to reconnect.
Set a breakpoint or line-by-line debugging
A breakpoint is a designated point in the code where the debugger pauses execution, allowing you to examine the program’s state. Visit Chrome for Developers to learn about breakpoints.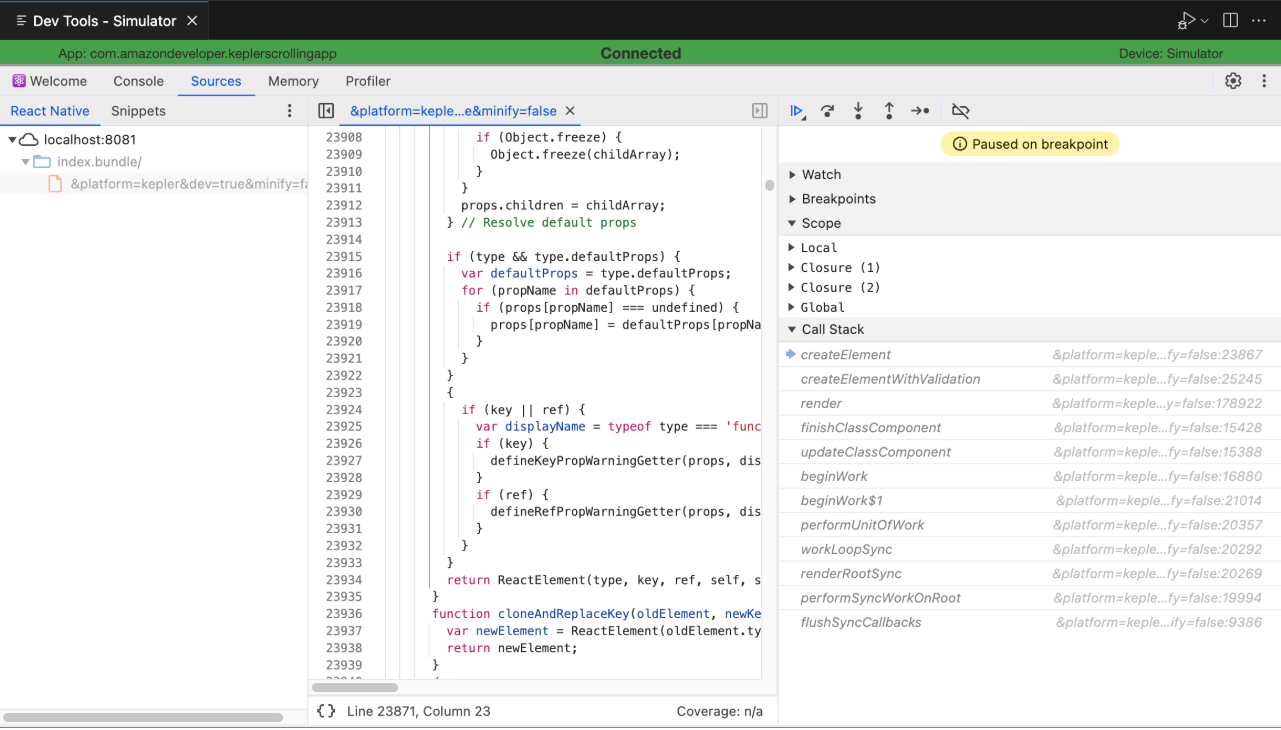
-
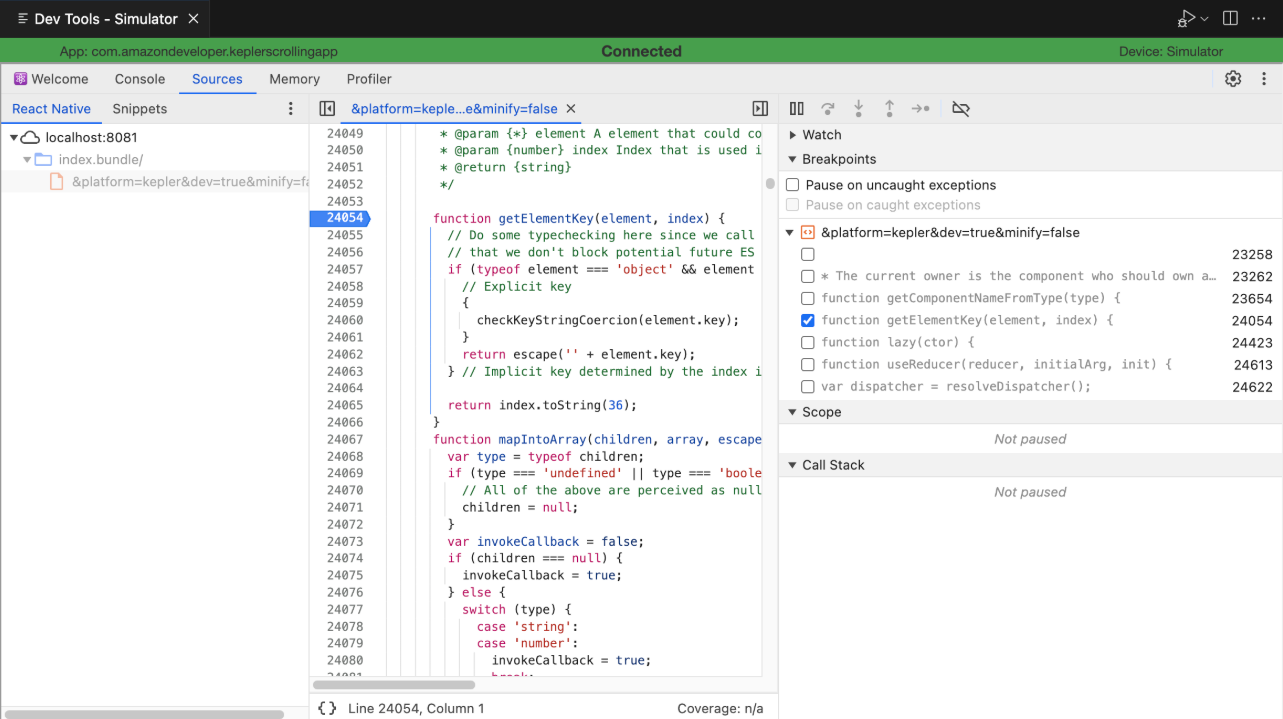
In the Sources tab, expand localhost:8081 > index.bundle/ and open the
&platform=kepler&dev=true&minify=falsefile. Search for the function or line you want to debug, then select the line number to set a breakpoint.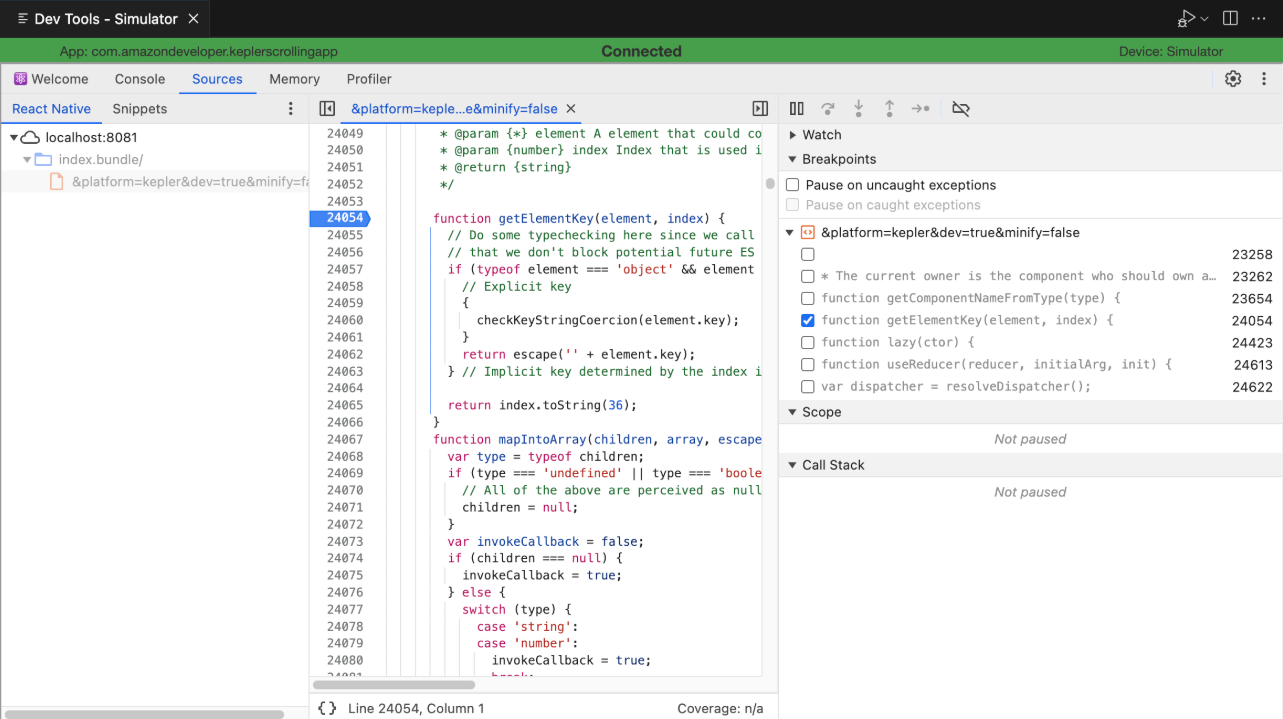
-
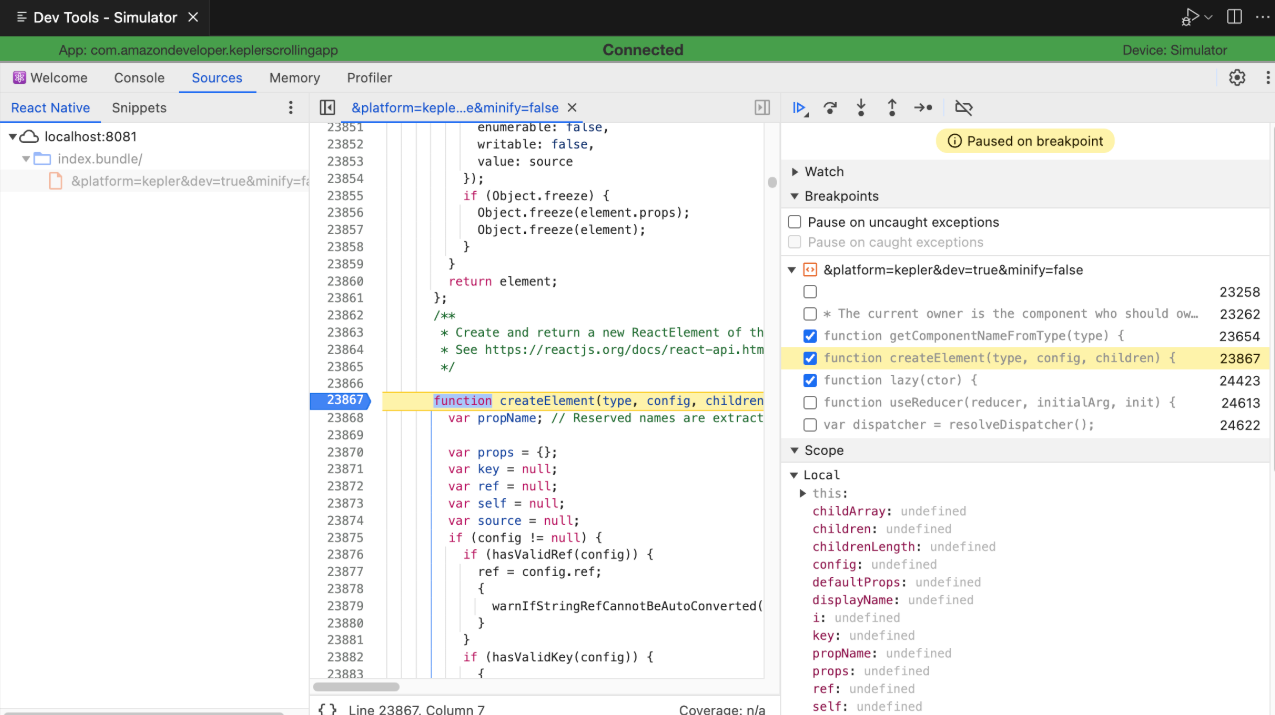
Execute the code in your app. When the debugger reaches the breakpoint, it pauses execution.
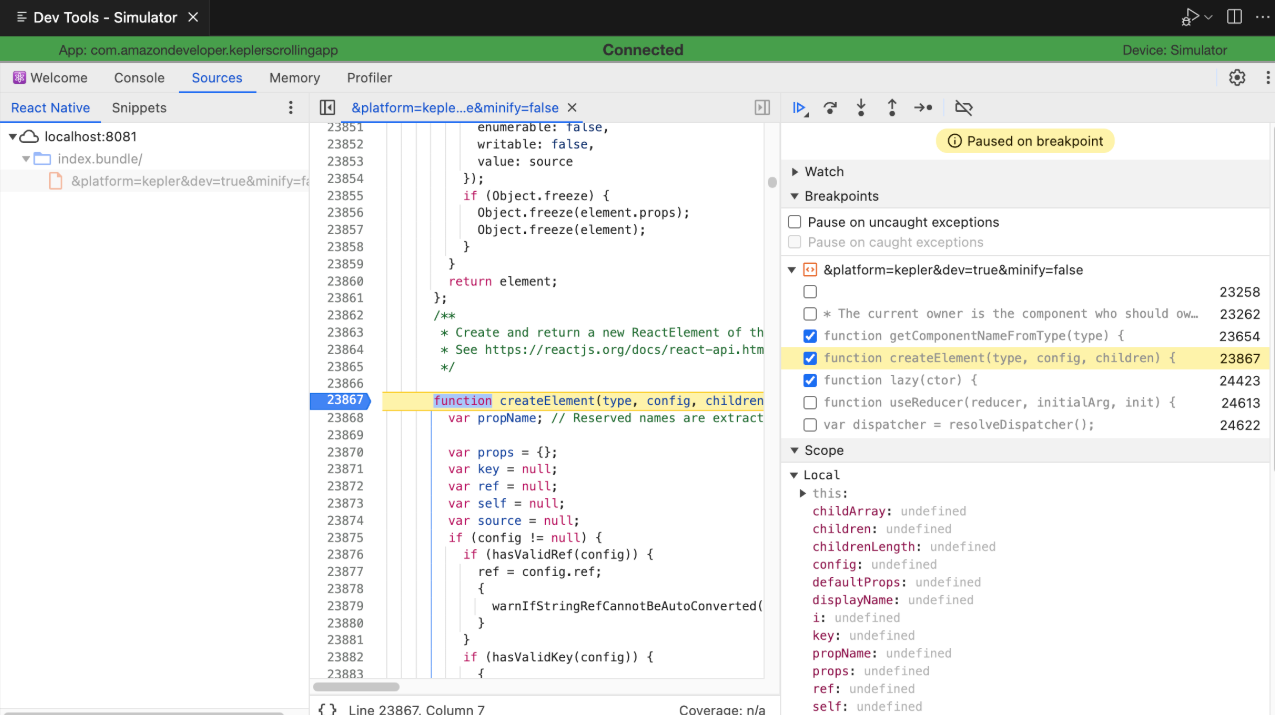
- Inspect the variables or control program execution as normal.