View Skill Metrics
Note: Sign in to the developer console to build or publish your skill.
You can use the Alexa developer console to generate reports of usage metrics for your skills. For details about skill metrics, see About Skill Metrics.
Access the Analytics dashboard
To access the Analytics page
- Sign in to the Alexa developer console.
- From the skill list, locate your skill, and then, in the dropdown under ACTIONS, select Edit.
- On the Analytics page, view the Summary metrics for your skill.
The metrics available on the Summary page depend on the category for your skill. - To switch between language models, in the language dropdown, select the language you want to view.
Or, to see metrics for all language models, in the language dropdown, select All. - To view analytics for a different skill in your account, from the Jump to analytics for: dropdown, select a skill name.
- To switch between development and live versions of your skill, from the Skill Stage dropdown, select the version that you want to view.
- To change the time interval, under Time Interval (UTC), choose the interval that you want to view.
Available intervals depend on the metrics shown. If you select the custom range, on the calendar, click the start date, and then click the end date. You can select a range up to 90 days. - To change the aggregation interval, click the Aggregation Period drop-down, and then choose the aggregation period for the time interval. The graph shows the sum of the data values over the selected aggregation period. Available aggregation periods depend on the selected time interval.
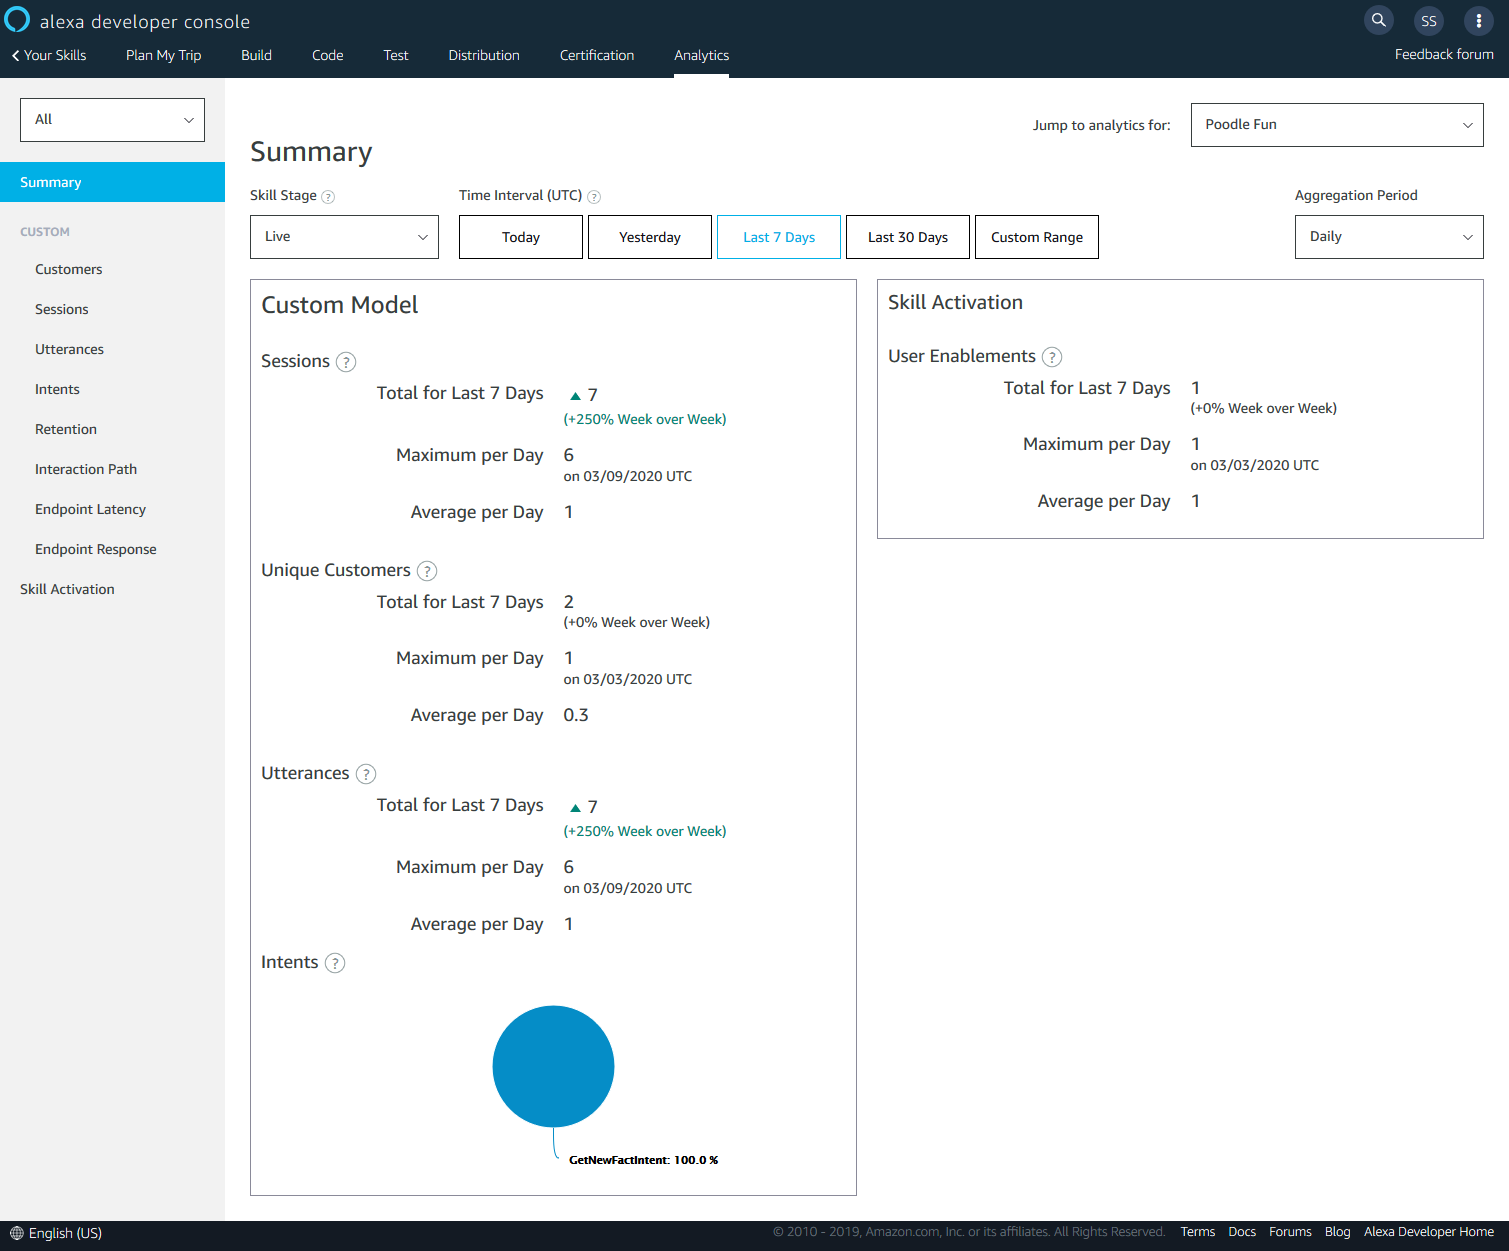
The following example shows the Analytics page for a custom skill in the developer console:
Related topics
- Interpret and Troubleshoot Skill Performance Metrics
- Download Message IDs for Troubleshooting
- Skill Metrics FAQ
Last updated: Jan 26, 2024